Investor Presentation
Key States Stepping Up To The Plate
Seeing Increased State/Local Funding In Our Footprint
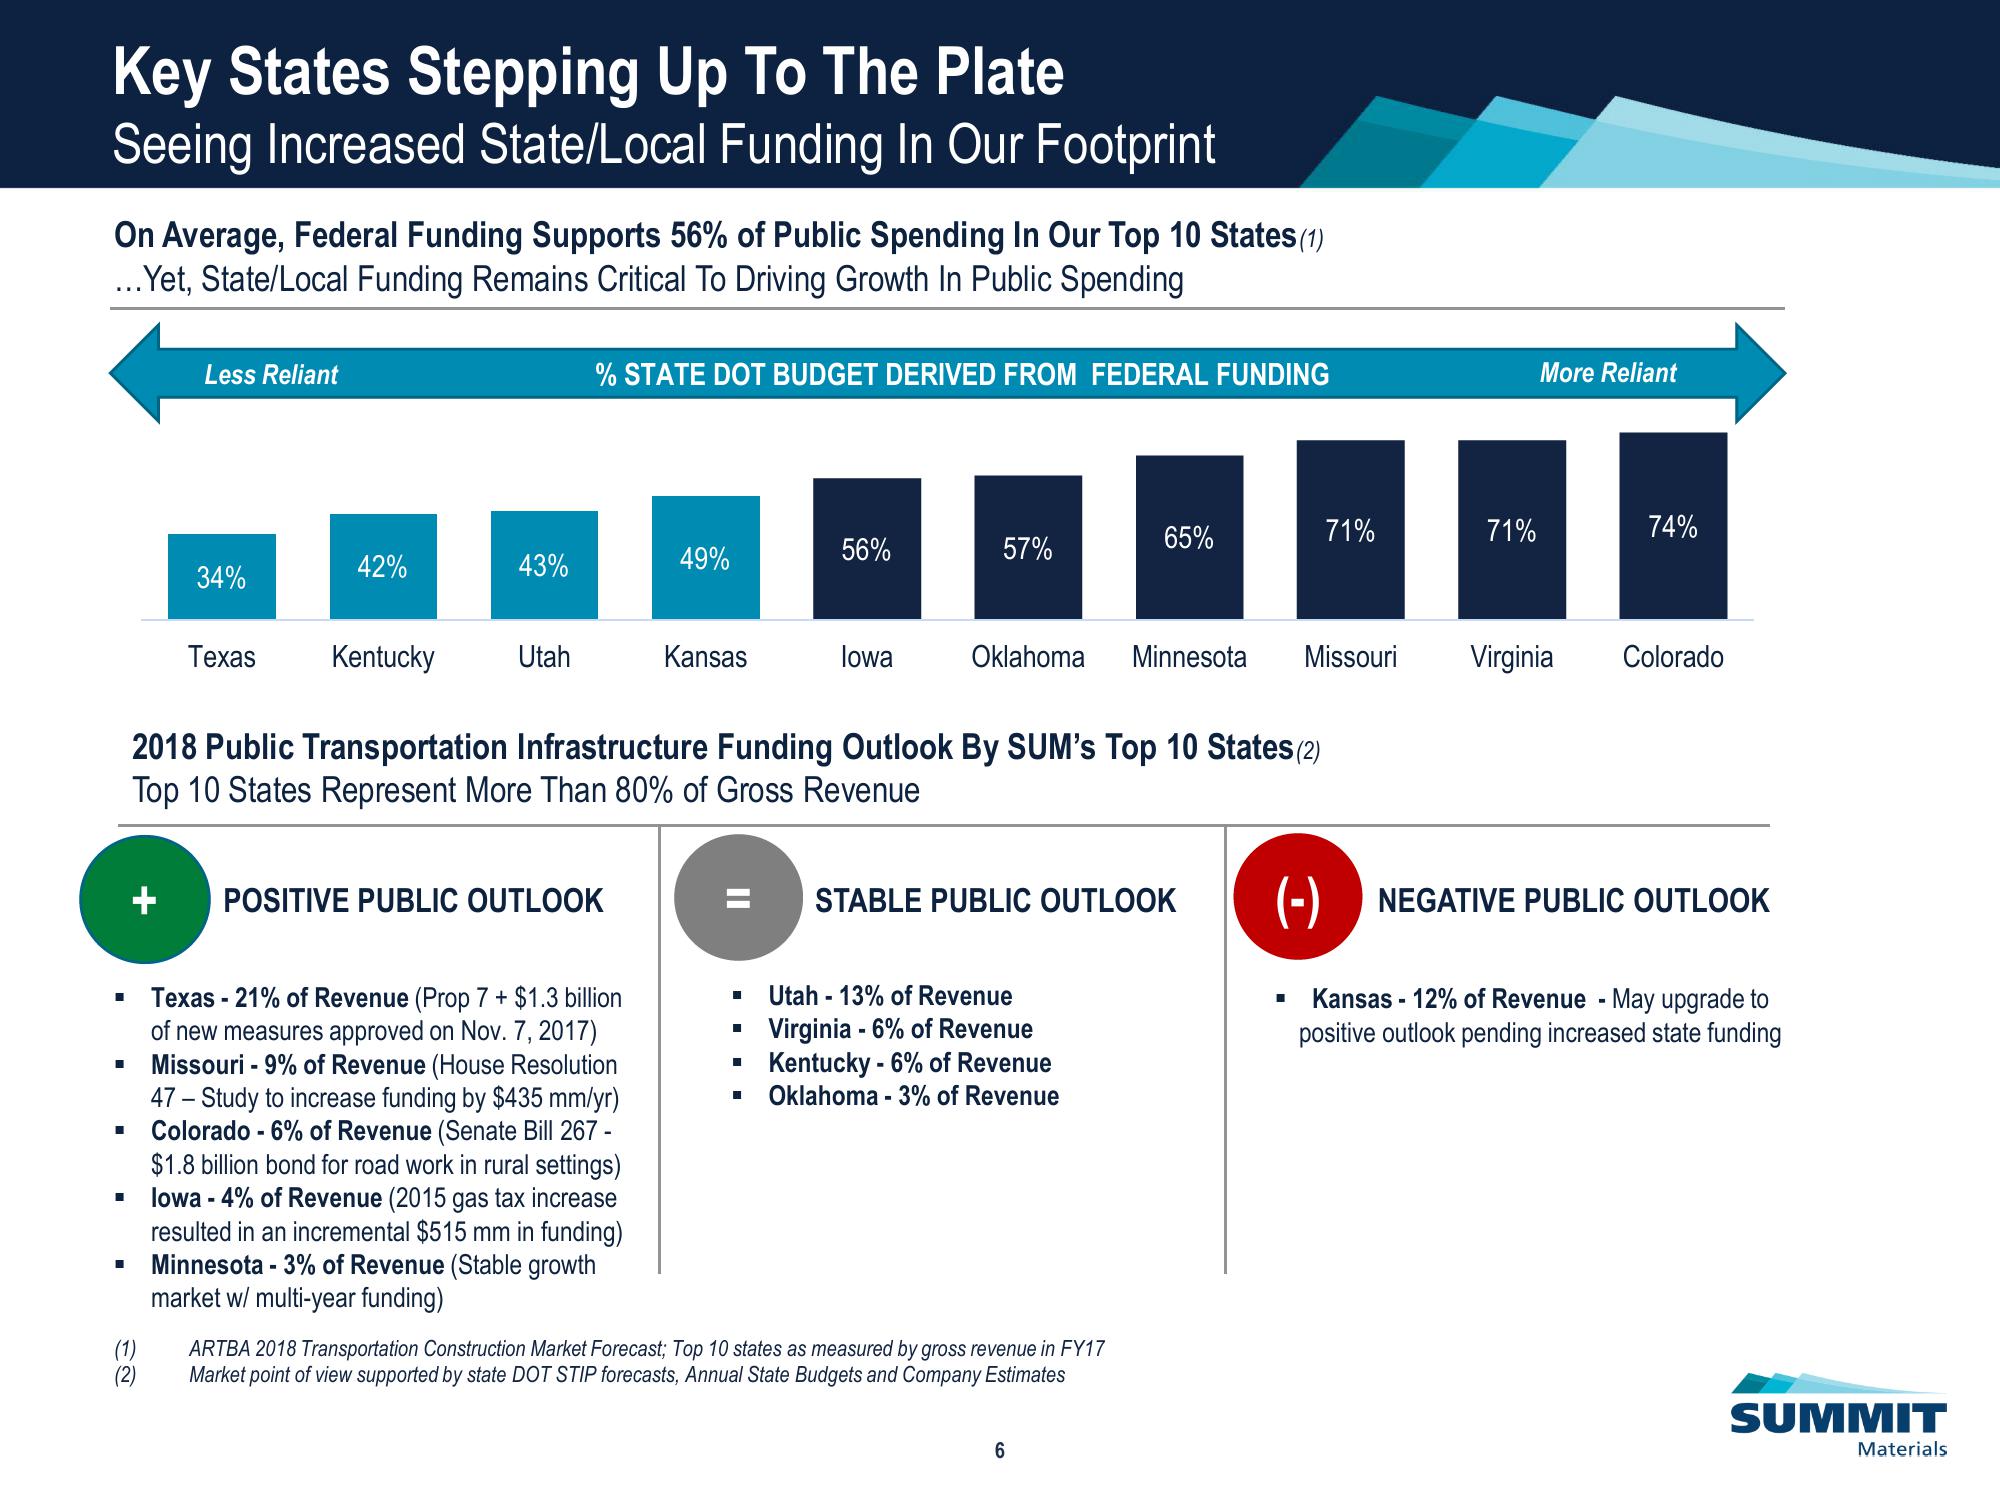
On Average, Federal Funding Supports 56% of Public Spending In Our Top 10 States (1)
...Yet, State/Local Funding Remains Critical To Driving Growth In Public Spending
■
■
■
■
Less Reliant
(1)
(2)
34%
Texas
42%
Kentucky
43%
Utah
% STATE DOT BUDGET DERIVED FROM FEDERAL FUNDING
POSITIVE PUBLIC OUTLOOK
49%
Texas - 21% of Revenue (Prop 7 + $1.3 billion
of new measures approved on Nov. 7, 2017)
Missouri - 9% of Revenue (House Resolution
47 - Study to increase funding by $435 mm/yr)
Colorado -6% of Revenue (Senate Bill 267 -
$1.8 billion bond for road work in rural settings)
lowa - 4% of Revenue (2015 gas tax increase
resulted in an incremental $515 mm in funding)
Minnesota - 3% of Revenue (Stable growth
market w/ multi-year funding)
Kansas
56%
lowa
2018 Public Transportation Infrastructure Funding Outlook By SUM's Top 10 States (2)
Top 10 States Represent More Than 80% of Gross Revenue
H
57%
Oklahoma Minnesota Missouri
Utah - 13% of Revenue
Virginia - 6% of Revenue
Kentucky - 6% of Revenue
H Oklahoma - 3% of Revenue
65%
ARTBA 2018 Transportation Construction Market Forecast; Top 10 states as measured by gross revenue in FY17
Market point of view supported by state DOT STIP forecasts, Annual State Budgets and Company Estimates
71%
6
71%
More Reliant
Virginia
STABLE PUBLIC OUTLOOK (-) NEGATIVE PUBLIC OUTLOOK
74%
Colorado
Kansas - 12% of Revenue - May upgrade to
positive outlook pending increased state funding
SUMMIT
MaterialsView entire presentation