Lead Real Estate Co IPO Presentation Deck
Lead Real Estate Co. Ltd
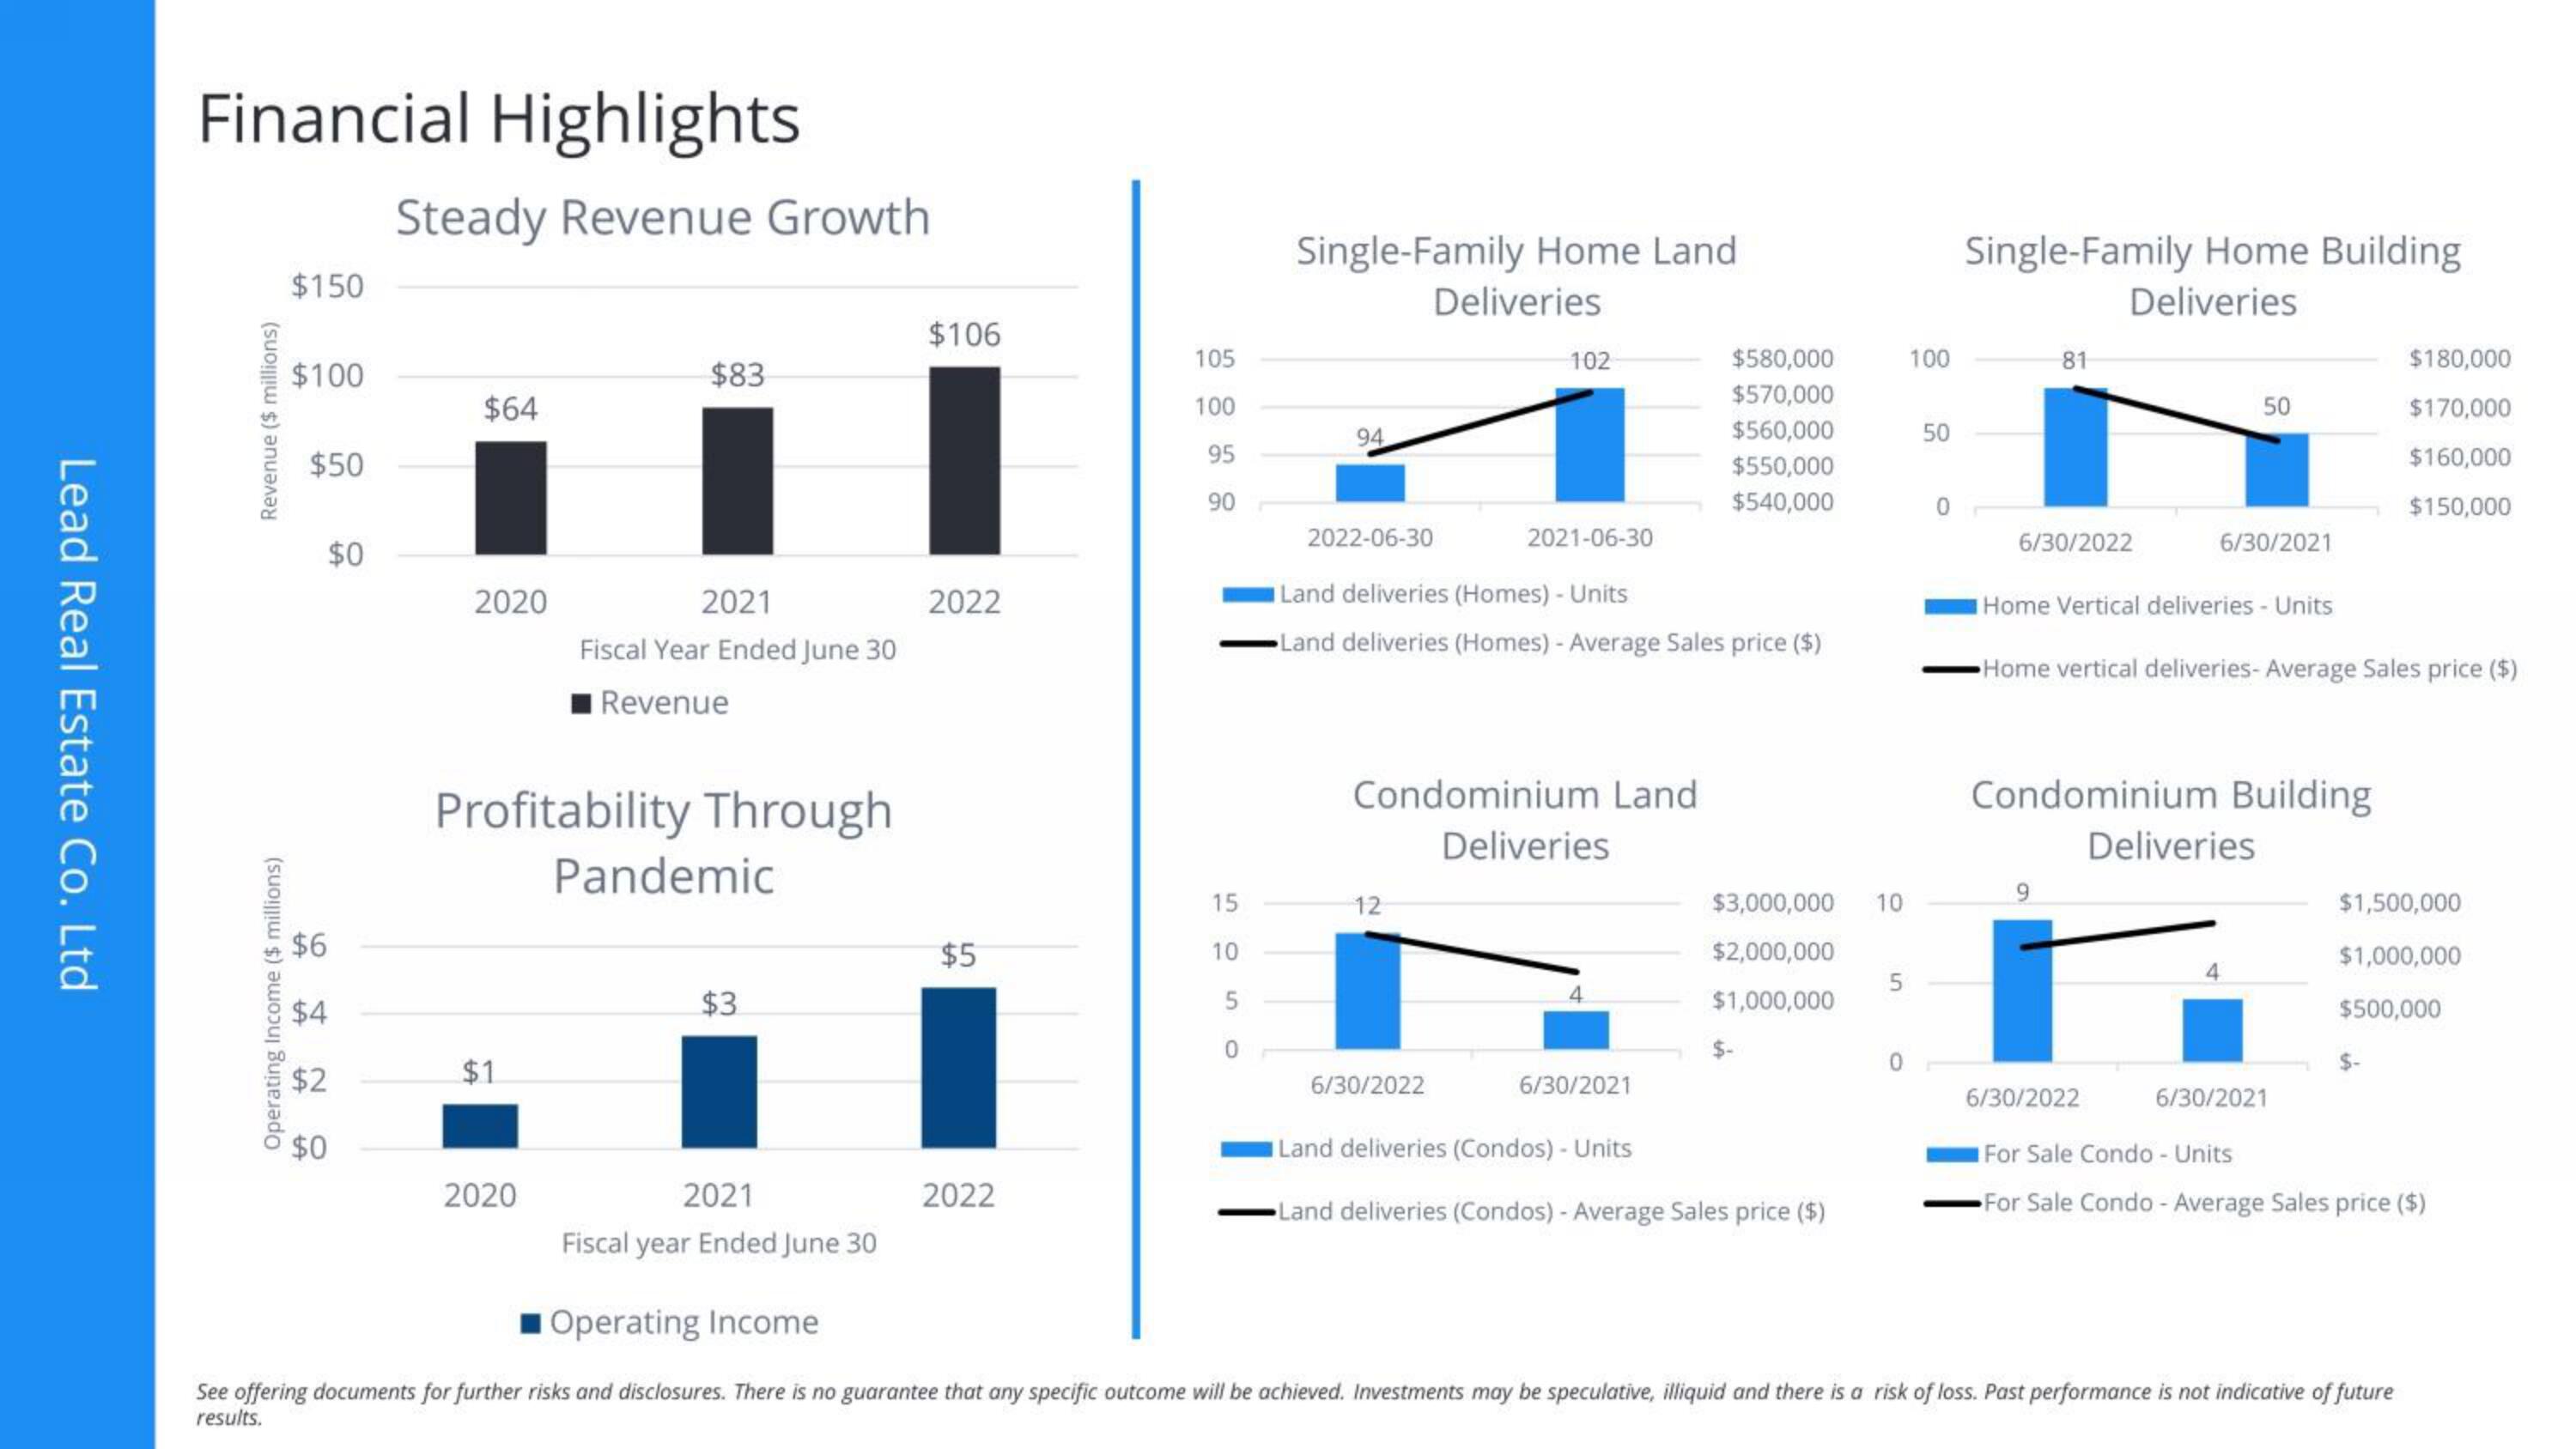
Financial Highlights
Revenue ($ millions)
Operating Income ($ millions)
$150
$100
$50
$6
$0
$4
$2
$0
Steady Revenue Growth
$64
2020
$1
$83
Profitability Through
2020
2021
Fiscal Year Ended June 30
Revenue
Pandemic
$3
2021
Fiscal year Ended June 30
$106
2022
$5
2022
105
100
95
90
15
10
5
0
Single-Family Home Land
Deliveries
94
102
2022-06-30
2021-06-30
Land deliveries (Homes) - Units
Land deliveries (Homes) - Average Sales price ($)
Condominium Land
Deliveries
12
6/30/2022
$580,000
$570,000
$560,000
$550,000
$540,000
6/30/2021
$3,000,000 10
$2,000,000
$1,000,000
Land deliveries (Condos) - Units
Land deliveries (Condos) - Average Sales price ($)
5
100
50
Single-Family Home Building
Deliveries
81
6/30/2022
50
6/30/2021
Home Vertical deliveries - Units
Home vertical deliveries- Average Sales price ($)
Condominium Building
Deliveries
6/30/2021
$180,000
$170,000
$160,000
$150,000
$1,500,000
$1,000,000
$500,000
6/30/2022
For Sale Condo - Units
For Sale Condo - Average Sales price ($)
Operating Income
See offering documents for further risks and disclosures. There is no guarantee that any specific outcome will be achieved. Investments may be speculative, illiquid and there is a risk of loss. Past performance is not indicative of future
results.View entire presentation