Wix Results Presentation Deck
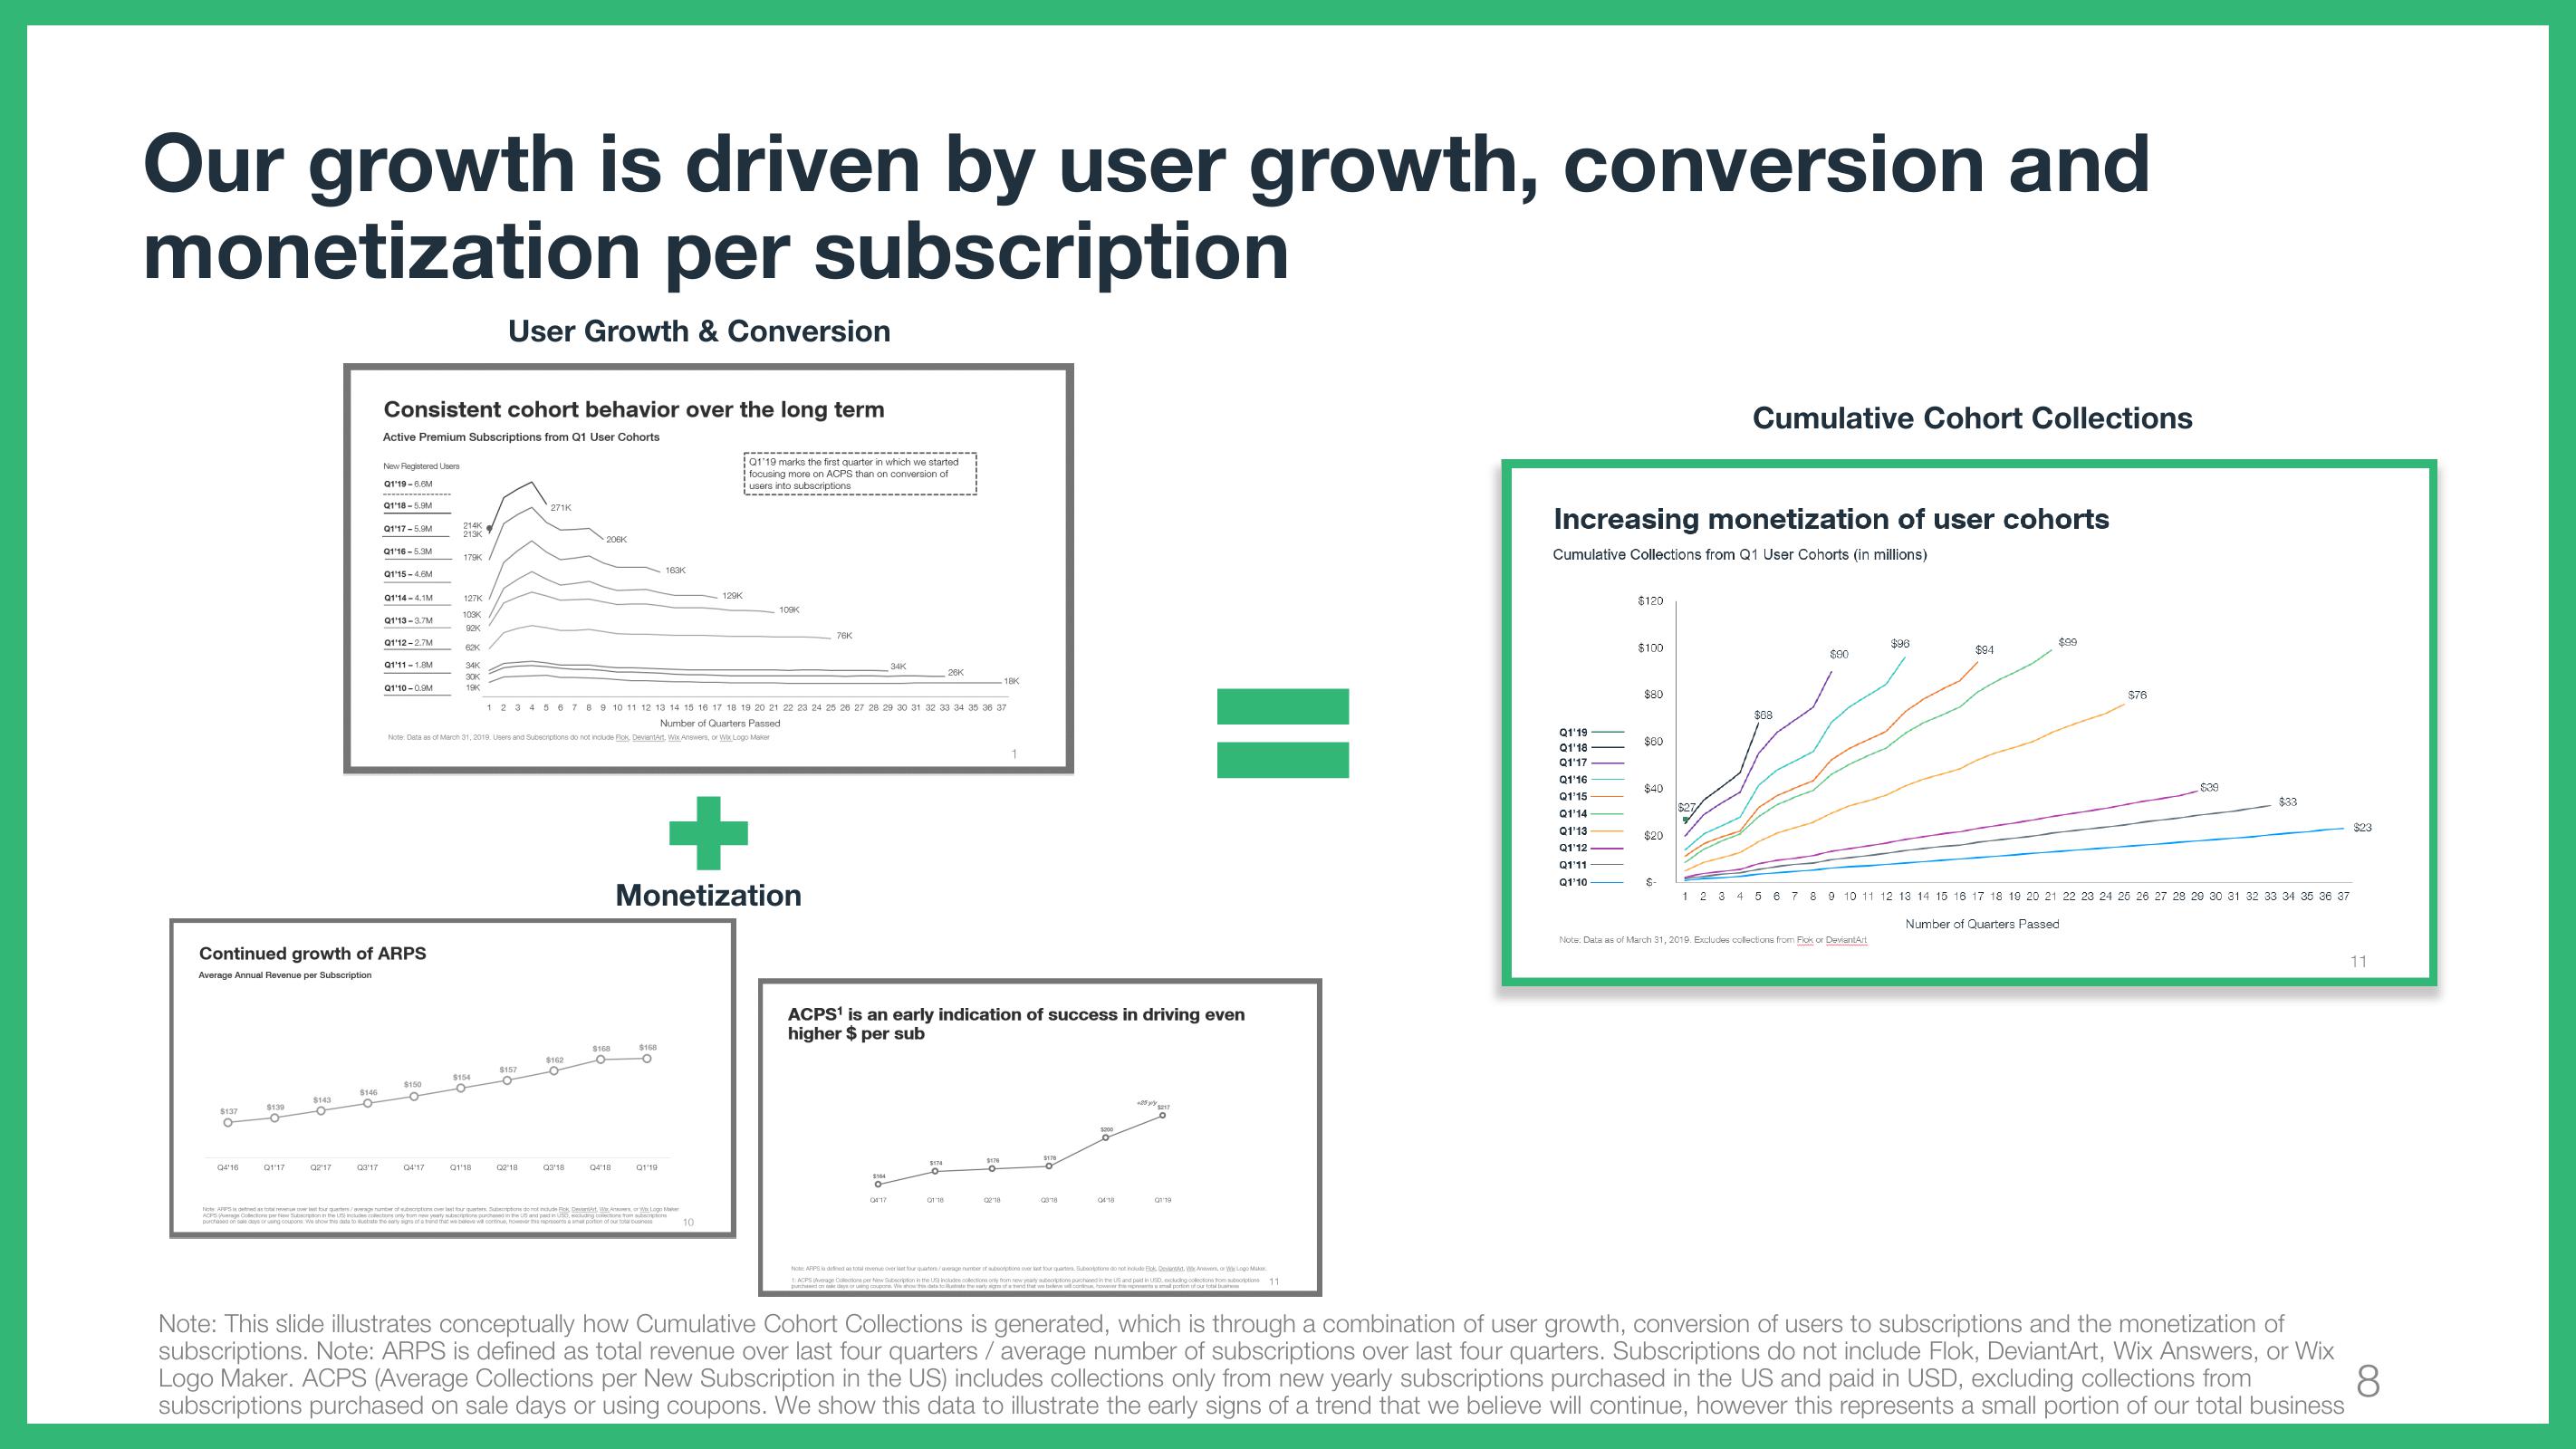
Our growth is driven by user growth, conversion and
monetization per subscription
User Growth & Conversion
$137
O
Q4'16
$139
Q1'17
$143
O
Q2'17
$146
O
Consistent cohort behavior over the long term
Active Premium Subscriptions from Q1 User Cohorts
03'17
New Registered Users
Q1'19-6.6M
Q1'18-5.9M
Q1'17-5.9M
Continued growth of ARPS
Average Annual Revenue per Subscription
Q1'16-5.3M
Q1'15-4.6M
Q1'14-4.1M
Q1'13-3.7M
Q1'12-2.7M
Q1'11-1.8M
Q1'10-0.9M
$150
O
214K
213K
Q4'17
179K
127K
103K
92K
62K
34K
30K
19K
$154
O
0118
Note: Data as of March 31, 2019. Users and Subscriptions do not include Flok, DeviantArt, Wix Answers, or Wix Logo Maker
271K
$157
O
Q2 18
206K
$162
03'18
$168
O
Q4'18
163K
1 2 3 4 5 6 7 8 9 10 11 12 13 14 15 16 17 18 19 20 21 22 23 24 25 26 27 28 29 30 31 32 33 34 35 36 37
Number of Quarters Passed
$168
-O
Q1'19
129K
Q1'19 marks the first quarter in which we started.
focusing more on ACPS than on conversion of
users into subscriptions
+
Monetization
Note: APPSded as to revenue over for quarters/verage number of subscriptions overlast four quarters Suscriptors do not include ok, Devot, WoW Logo M
ACPS Average Colections per New Subscrpon the US includes lects only from new yeaty subscription pached in the US and ped in US excluding collections from suction
purchased on sale days or using coupons: We show this data to strate the sony signs of a thind that we belove will continue, however this representa amat portion of our total business
10
109K
76K
34K
0417
26K
18K
01:16
ACPS¹ is an early indication of success in driving even
higher $ per sub
1
04:18
+25 y $217
01/19
Note: APPS la defined a total revenue over last four quarters/average number of subsorptions over last four quarters Subotations do not include Elok Dessed. WAwes or W Logo Maker
purchased and days of using coupons. We show the dets to strate the early sign of a hand that we been want her pour notions 11
or
Increasing monetization of user cohorts
Cumulative Collections from Q1 User Cohorts (in millions)
Q1'19
Q1'18
Q1'17
Q1'16
Q1'15
Q1'14
Q1'13
Q1'12
Q1'11
Q1'10
$120
$100
$80
$60
$40
$20
$-
Cumulative Cohort Collections
$27
$68
$90
$96
Note: Data as of March 31, 2019. Excludes collections from Flok or DeviantArt
$94
$99
$76
$39
$33
1 2 3 4 5 6 7 8 9 10 11 12 13 14 15 16 17 18 19 20 21 22 23 24 25 26 27 28 29 30 31 32 33 34 35 36 37
Number of Quarters Passed
$23
11
Note: This slide illustrates conceptually how Cumulative Cohort Collections is generated, which is through a combination of user growth, conversion of users to subscriptions and the monetization of
subscriptions. Note: ARPS is defined as total revenue over last four quarters / average number of subscriptions over last four quarters. Subscriptions do not include Flok, DeviantArt, Wix Answers, or Wix
Logo Maker. ACPS (Average Collections per New Subscription in the US) includes collections only from new yearly subscriptions purchased in the US and paid in USD, excluding collections from 8
subscriptions purchased on sale days or using coupons. We show this data to illustrate the early signs of a trend that we believe will continue, however this represents a small portion of our total businessView entire presentation