Silicon Valley Bank Results Presentation Deck
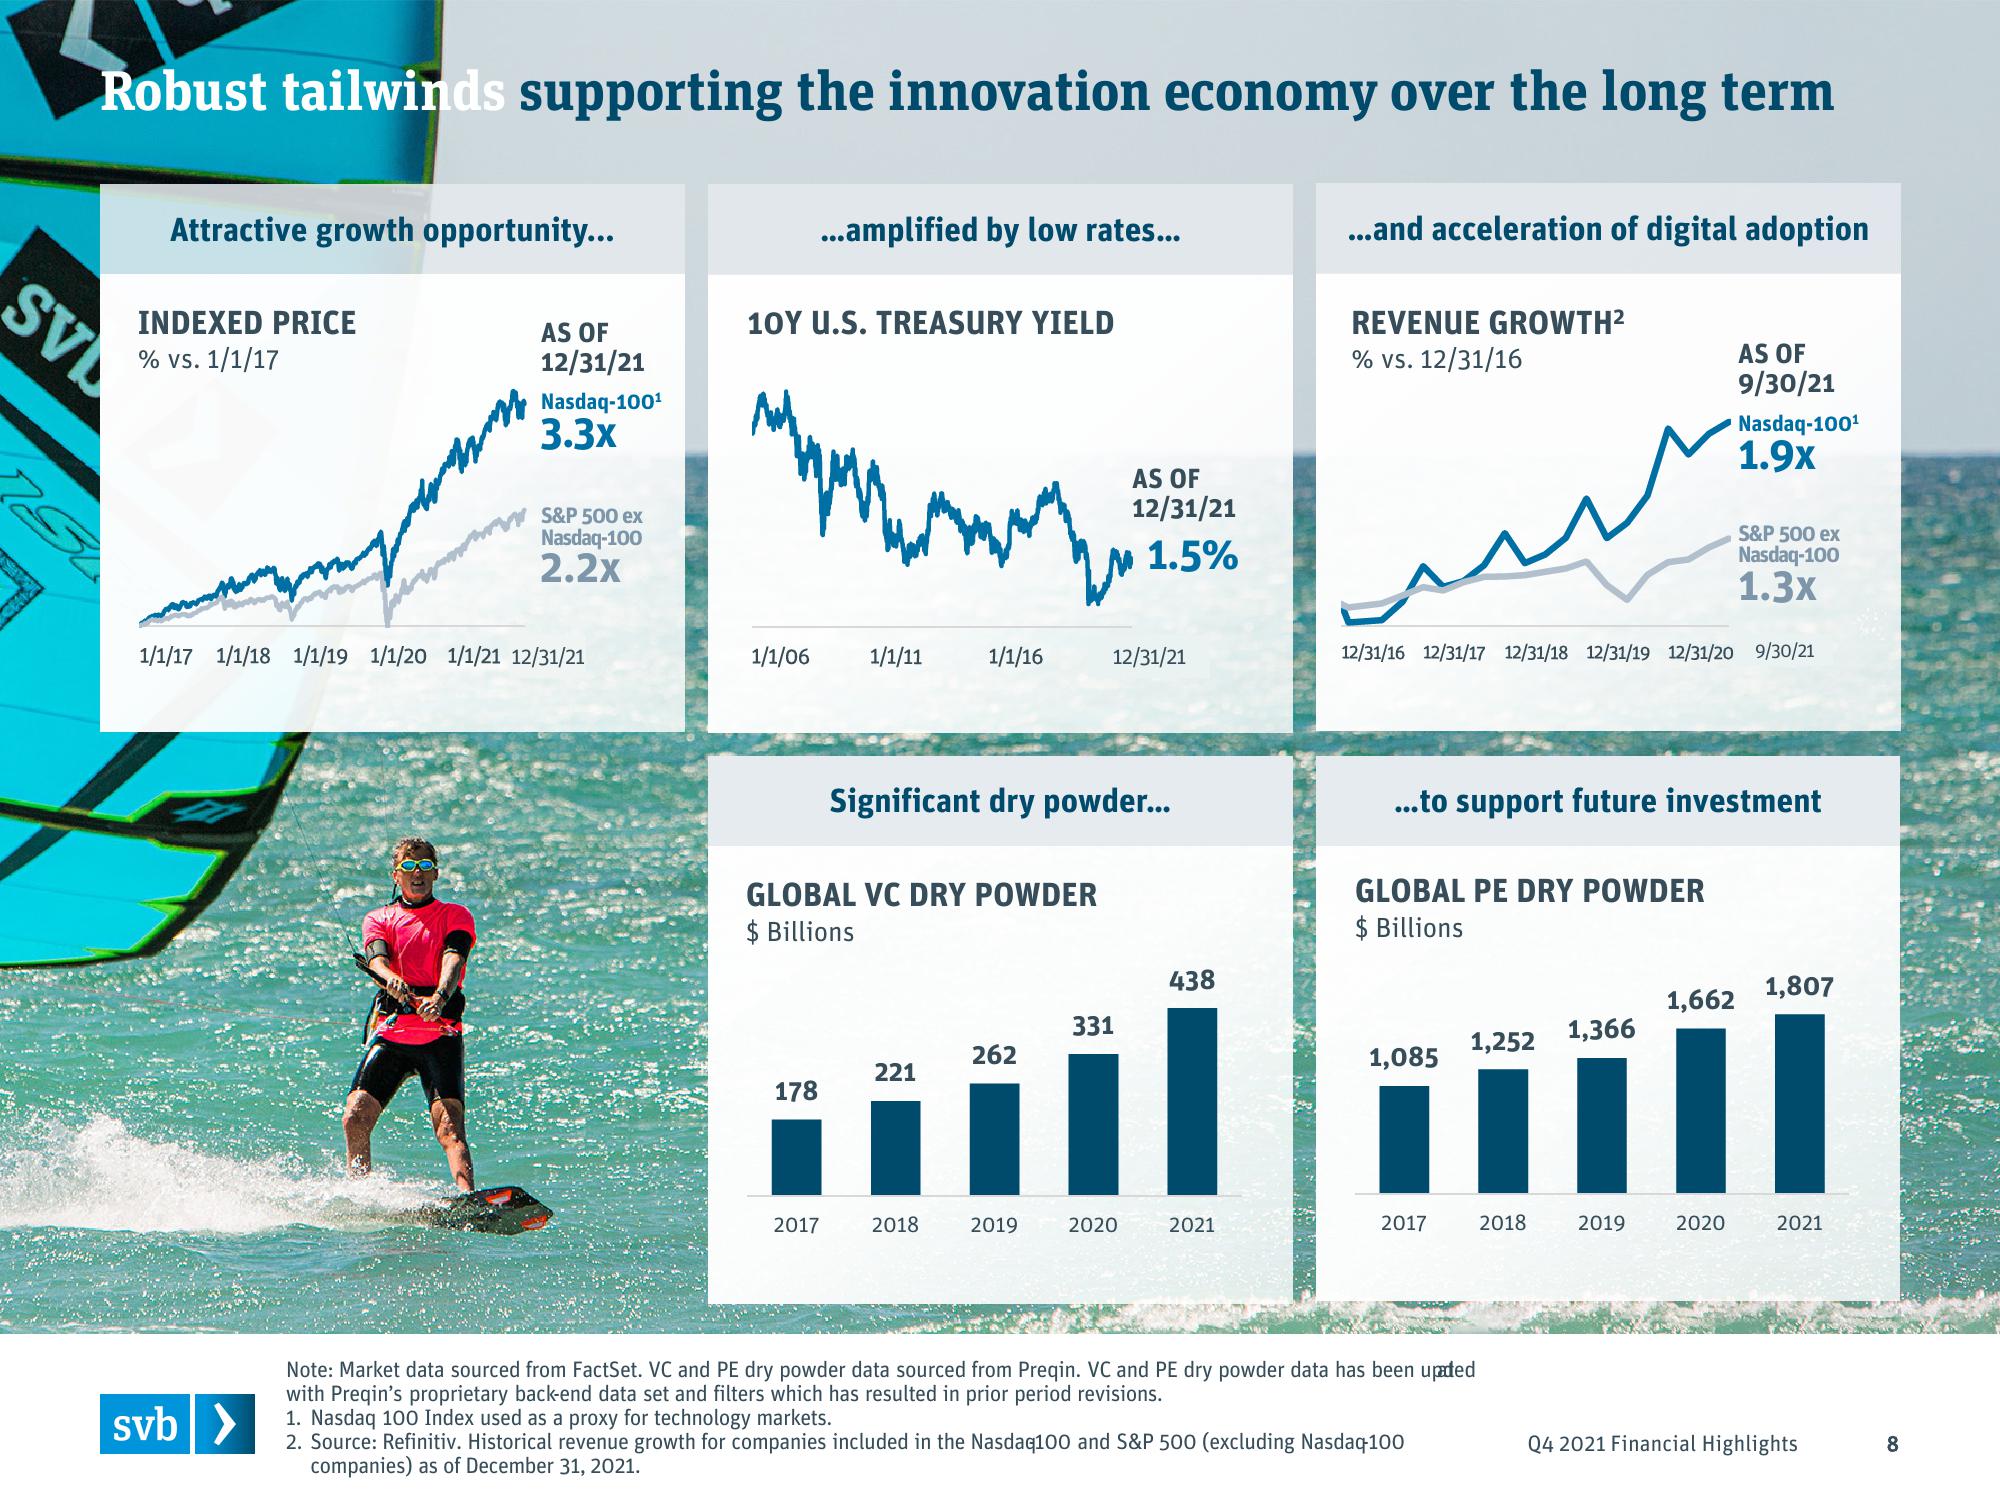
Robust tailwinds supporting the innovation economy over the long term
SV
Attractive growth opportunity...
INDEXED PRICE
% vs. 1/1/17
Un
svb >
AS OF
12/31/21
U
Nasdaq-100¹
3.3x
S&P 500 ex
Nasdaq-100
2.2x
1/1/17 1/1/18 1/1/19 1/1/20 1/1/21 12/31/21
10Y U.S. TREASURY YIELD
1/1/06
...amplified by low rates...
178
2017
1/1/11
GLOBAL VC DRY POWDER
$ Billions
1/1/16
221
Significant dry powder...
2018
262
2019
12/31/21
AS OF
12/31/21
1.5%
331
2020
438
2021
...and acceleration of digital adoption
REVENUE GROWTH²
% vs. 12/31/16
GLOBAL PE DRY POWDER
$ Billions
12/31/16 12/31/17 12/31/18 12/31/19 12/31/20 9/30/21
1,085
...to support future investment
2017
1,252 1,366
Note: Market data sourced from FactSet. VC and PE dry powder data sourced from Preqin. VC and PE dry powder data has been upated
with Preqin's proprietary back-end data set and filters which has resulted in prior period revisions.
1. Nasdaq 100 Index used as a proxy for technology markets.
2. Source: Refinitiv. Historical revenue growth for companies included in the Nasdaq100 and S&P 500 (excluding Nasdaq-100
companies) as of December 31, 2021.
2018
AS OF
9/30/21
2019
Nasdaq-100¹
1.9x
S&P 500 ex
Nasdaq-100
1.3x
2020
1,807
1,662
11
2021
Q4 2021 Financial Highlights
8View entire presentation