Silicon Valley Bank Results Presentation Deck
Strong PE investment and borrowing by technology and life science/healthcare
clients drove robust loan growth; Expect FY'21 average loan % growth in the mid 30s
●
●
Q1'21 activity
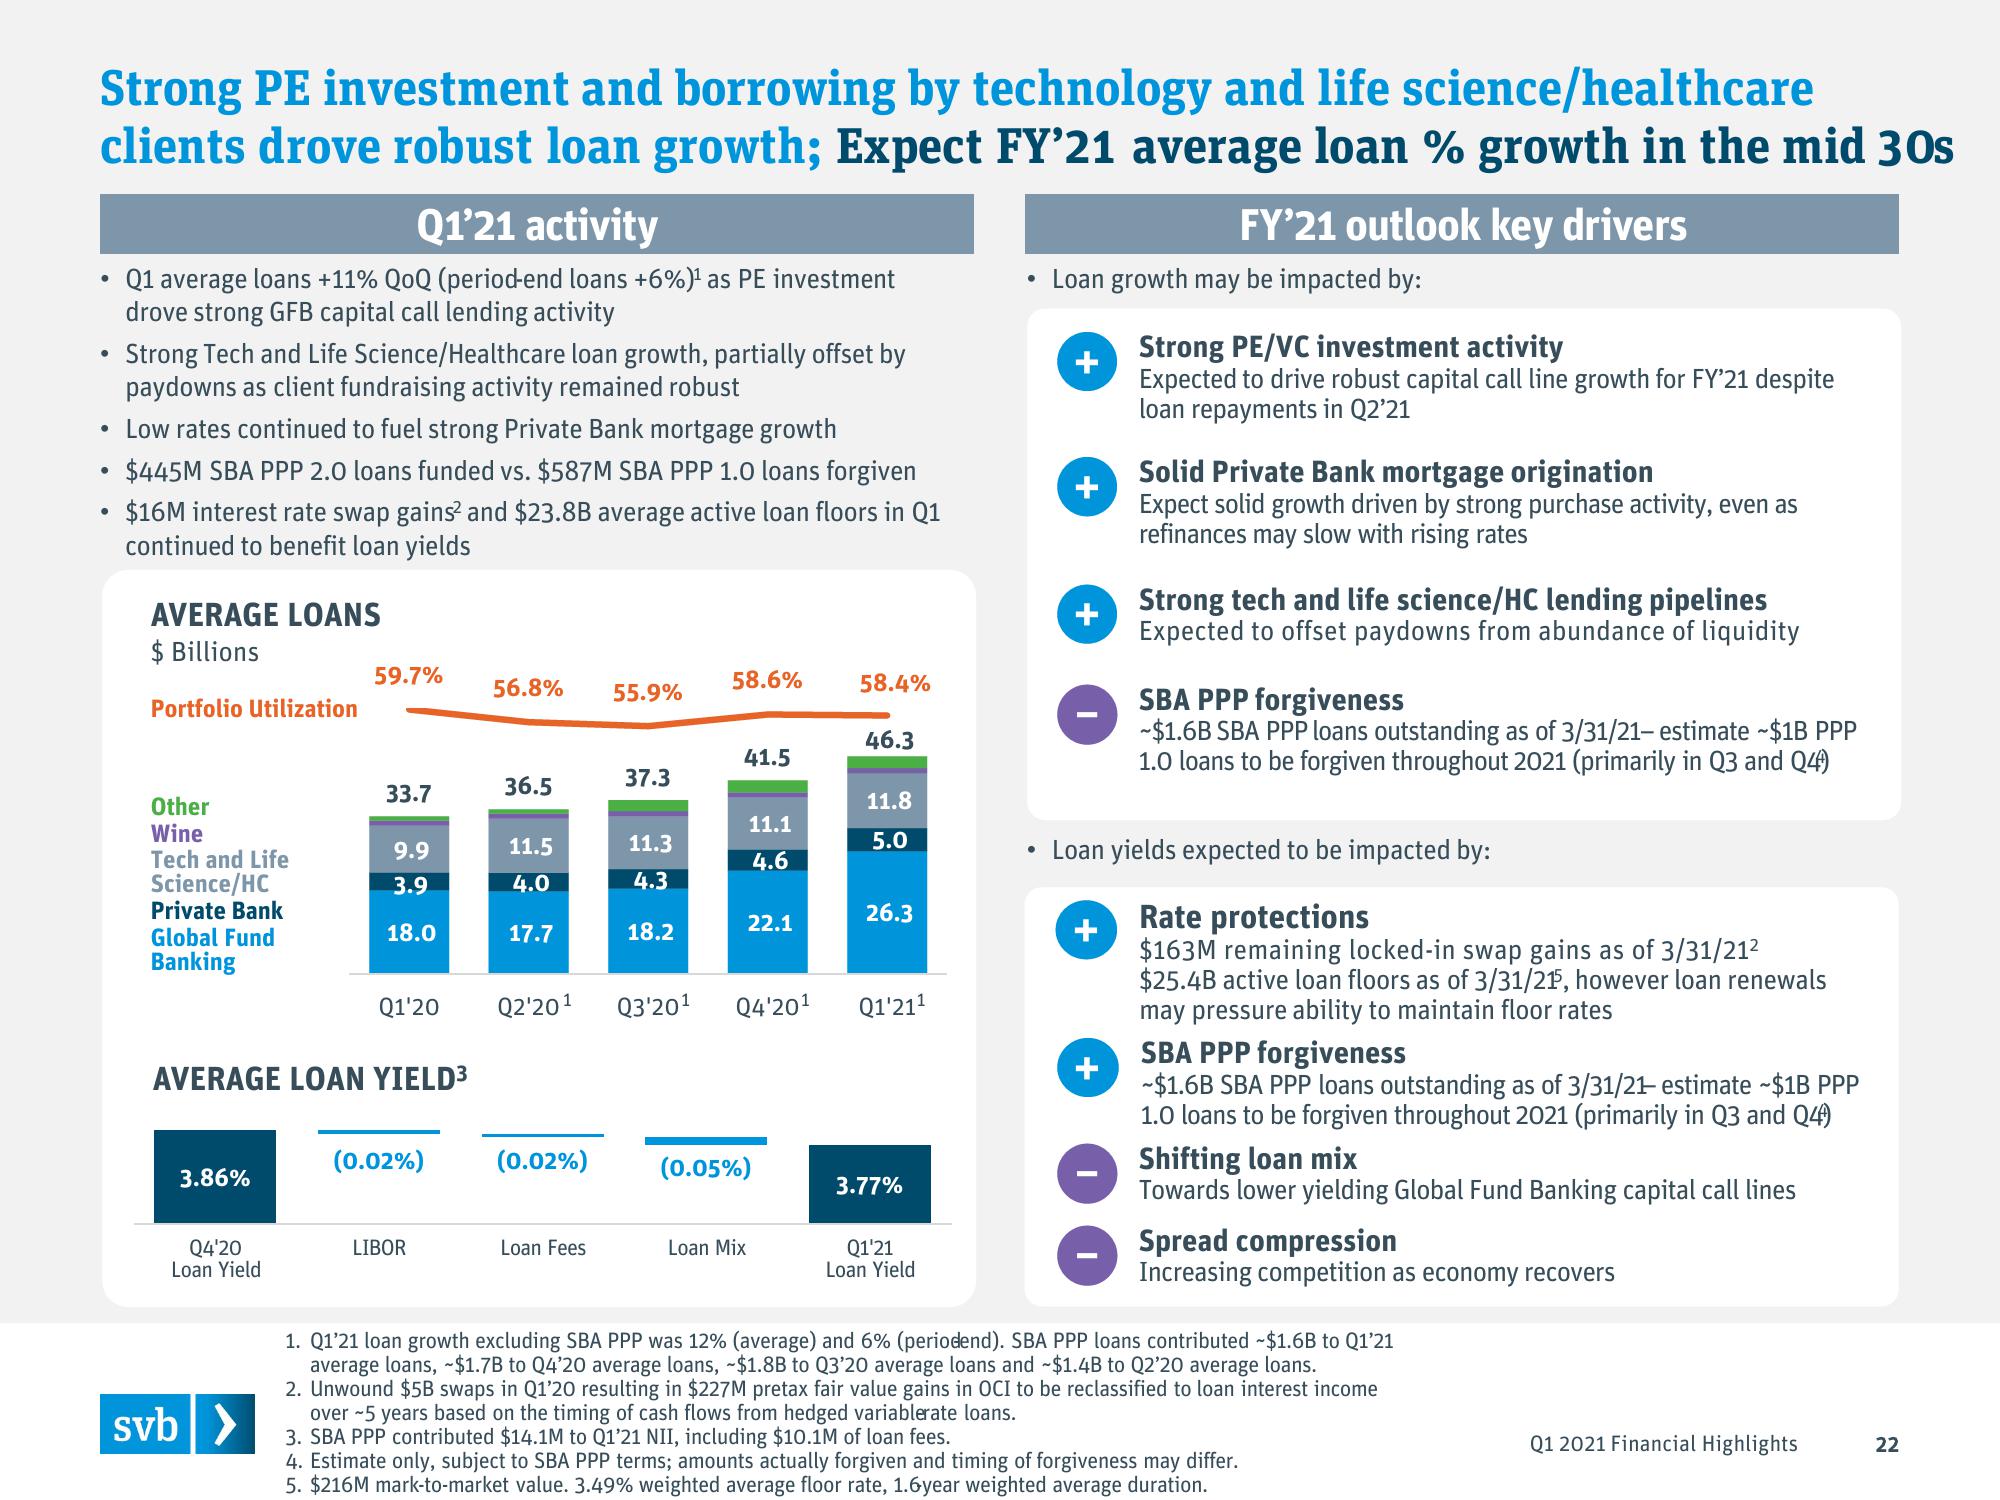
Q1 average loans +11% QOQ (period-end loans +6%) ¹ as PE investment
drove strong GFB capital call lending activity
Strong Tech and Life Science/Healthcare loan growth, partially offset by
paydowns as client fundraising activity remained robust
• Low rates continued to fuel strong Private Bank mortgage growth
$445M SBA PPP 2.0 loans funded vs. $587M SBA PPP 1.0 loans forgiven
$16M interest rate swap gains² and $23.8B average active loan floors in Q1
continued to benefit loan yields
AVERAGE LOANS
$ Billions
Portfolio Utilization
Other
Wine
Tech and Life
Science/HC
Private Bank
Global Fund
Banking
3.86%
Q4'20
Loan Yield
59.7%
svb>
33.7
AVERAGE LOAN YIELD³
9.9
3.9
18.0
Q1'20
(0.02%)
LIBOR
56.8%
36.5
11.5
4.0
17.7
(0.02%)
55.9%
Loan Fees
37.3
11.3
4.3
18.2
58.6%
41.5
11.1
4.6
22.1
Loan Mix
(0.05%)
58.4%
Q2'20¹ Q3'20¹ Q4'20¹ Q1'21¹
46.3
11.8
5.0
26.3
3.77%
Q1'21
Loan Yield
Loan growth may be impacted by:
+
+
+
FY'21 outlook key drivers
+
+
Strong PE/VC investment activity
Expected to drive robust capital call line growth for FY'21 despite
loan repayments in Q2'21
Solid Private Bank mortgage origination
Expect solid growth driven by strong purchase activity, even as
refinances may slow with rising rates
Strong tech and life science/HC lending pipelines
Expected to offset paydowns from abundance of liquidity
Loan yields expected to be impacted by:
Rate protections
$163M remaining locked-in swap gains as of 3/31/21²
$25.4B active loan floors as of 3/31/215, however loan renewals
may pressure ability to maintain floor rates
SBA PPP forgiveness
~$1.6B SBA PPP loans outstanding as of 3/31/21- estimate ~$1B PPP
1.0 loans to be forgiven throughout 2021 (primarily in Q3 and Q4)
SBA PPP forgiveness
~$1.6B SBA PPP loans outstanding as of 3/31/21- estimate ~$1B PPP
1.0 loans to be forgiven throughout 2021 (primarily in Q3 and Q4)
Shifting loan mix
Towards lower yielding Global Fund Banking capital call lines
Spread compression
Increasing competition as economy recovers
1. Q1'21 loan growth excluding SBA PPP was 12% (average) and 6% (periodend). SBA PPP loans contributed ~$1.6B to Q1'21
average loans, $1.7B to Q4'20 average loans, -$1.8B to Q3'20 average loans and ~$1.4B to Q2'20 average loans.
2. Unwound $5B swaps in Q1'20 resulting in $227M pretax fair value gains in OCI to be reclassified to loan interest income
over 5 years based on the timing of cash flows from hedged variablerate loans.
3. SBA PPP contributed $14.1M to Q1'21 NII, including $10.1M of loan fees.
4. Estimate only, subject to SBA PPP terms; amounts actually forgiven and timing of forgiveness may differ.
5. $216M mark-to-market value. 3.49% weighted average floor rate, 1.6year weighted average duration.
Q1 2021 Financial Highlights
22View entire presentation