AstraZeneca Investor Day Presentation Deck
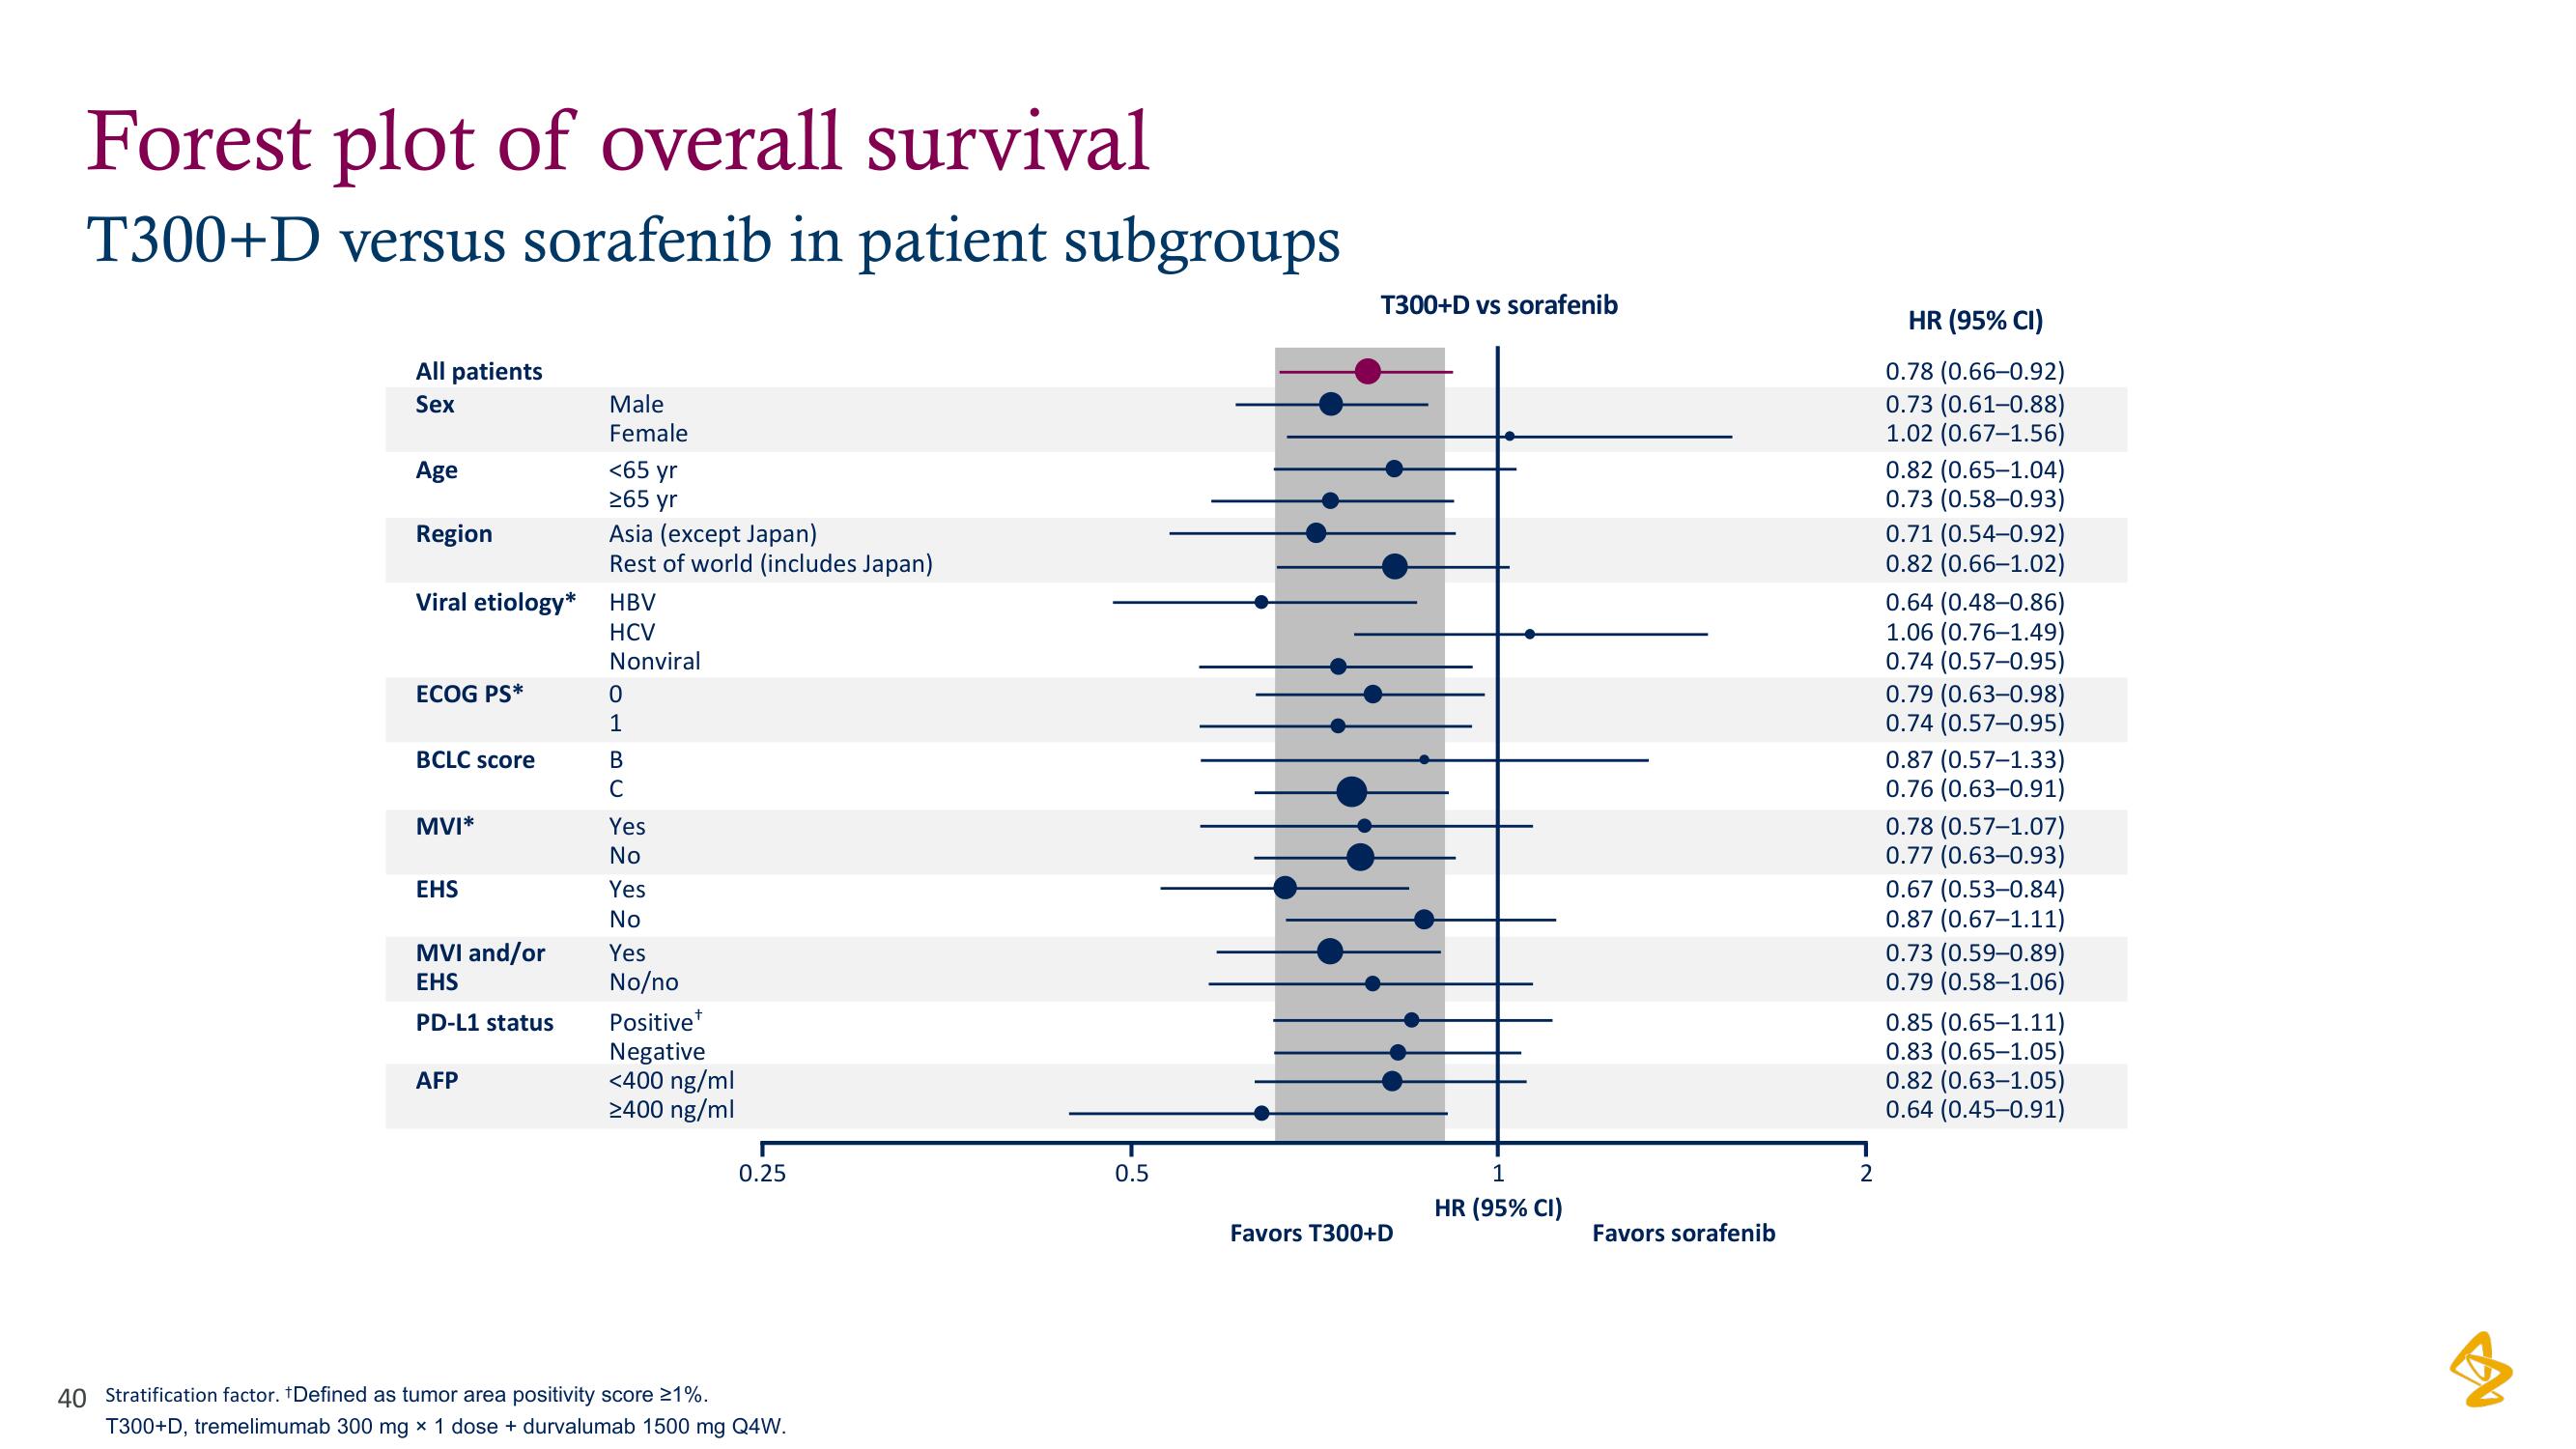
Forest plot of overall survival
T300+D versus sorafenib in patient subgroups
All patients
Sex
Age
Region
Viral etiology*
ECOG PS*
BCLC score
MVI*
EHS
MVI and/or
EHS
PD-L1 status
AFP
Male
Female
<65 yr
≥65 yr
Asia (except Japan)
Rest of world (includes Japan)
HBV
HCV
Nonviral
0
1
B
C
Yes
No
Yes
No
Yes
No/no
Positive+
Negative
<400 ng/ml
>400 ng/ml
0.25
40 Stratification factor. *Defined as tumor area positivity score 21%.
T300+D, tremelimumab 300 mg × 1 dose + durvalumab 1500 mg Q4W.
0.5
T300+D vs sorafenib
Favors T300+D
1
HR (95% CI)
Favors sorafenib
2
HR (95% CI)
0.78 (0.66-0.92)
0.73 (0.61-0.88)
1.02 (0.67-1.56)
0.82 (0.65-1.04)
0.73 (0.58-0.93)
0.71 (0.54-0.92)
0.82 (0.66-1.02)
0.64 (0.48-0.86)
1.06 (0.76-1.49)
0.74 (0.57-0.95)
0.79 (0.63-0.98)
0.74 (0.57-0.95)
0.87 (0.57-1.33)
0.76 (0.63-0.91)
0.78 (0.57-1.07)
0.77 (0.63-0.93)
0.67 (0.53-0.84)
0.87 (0.67-1.11)
0.73 (0.59-0.89)
0.79 (0.58-1.06)
0.85 (0.65-1.11)
0.83 (0.65-1.05)
0.82 (0.63-1.05)
0.64 (0.45-0.91)
BView entire presentation