Silicon Valley Bank Results Presentation Deck
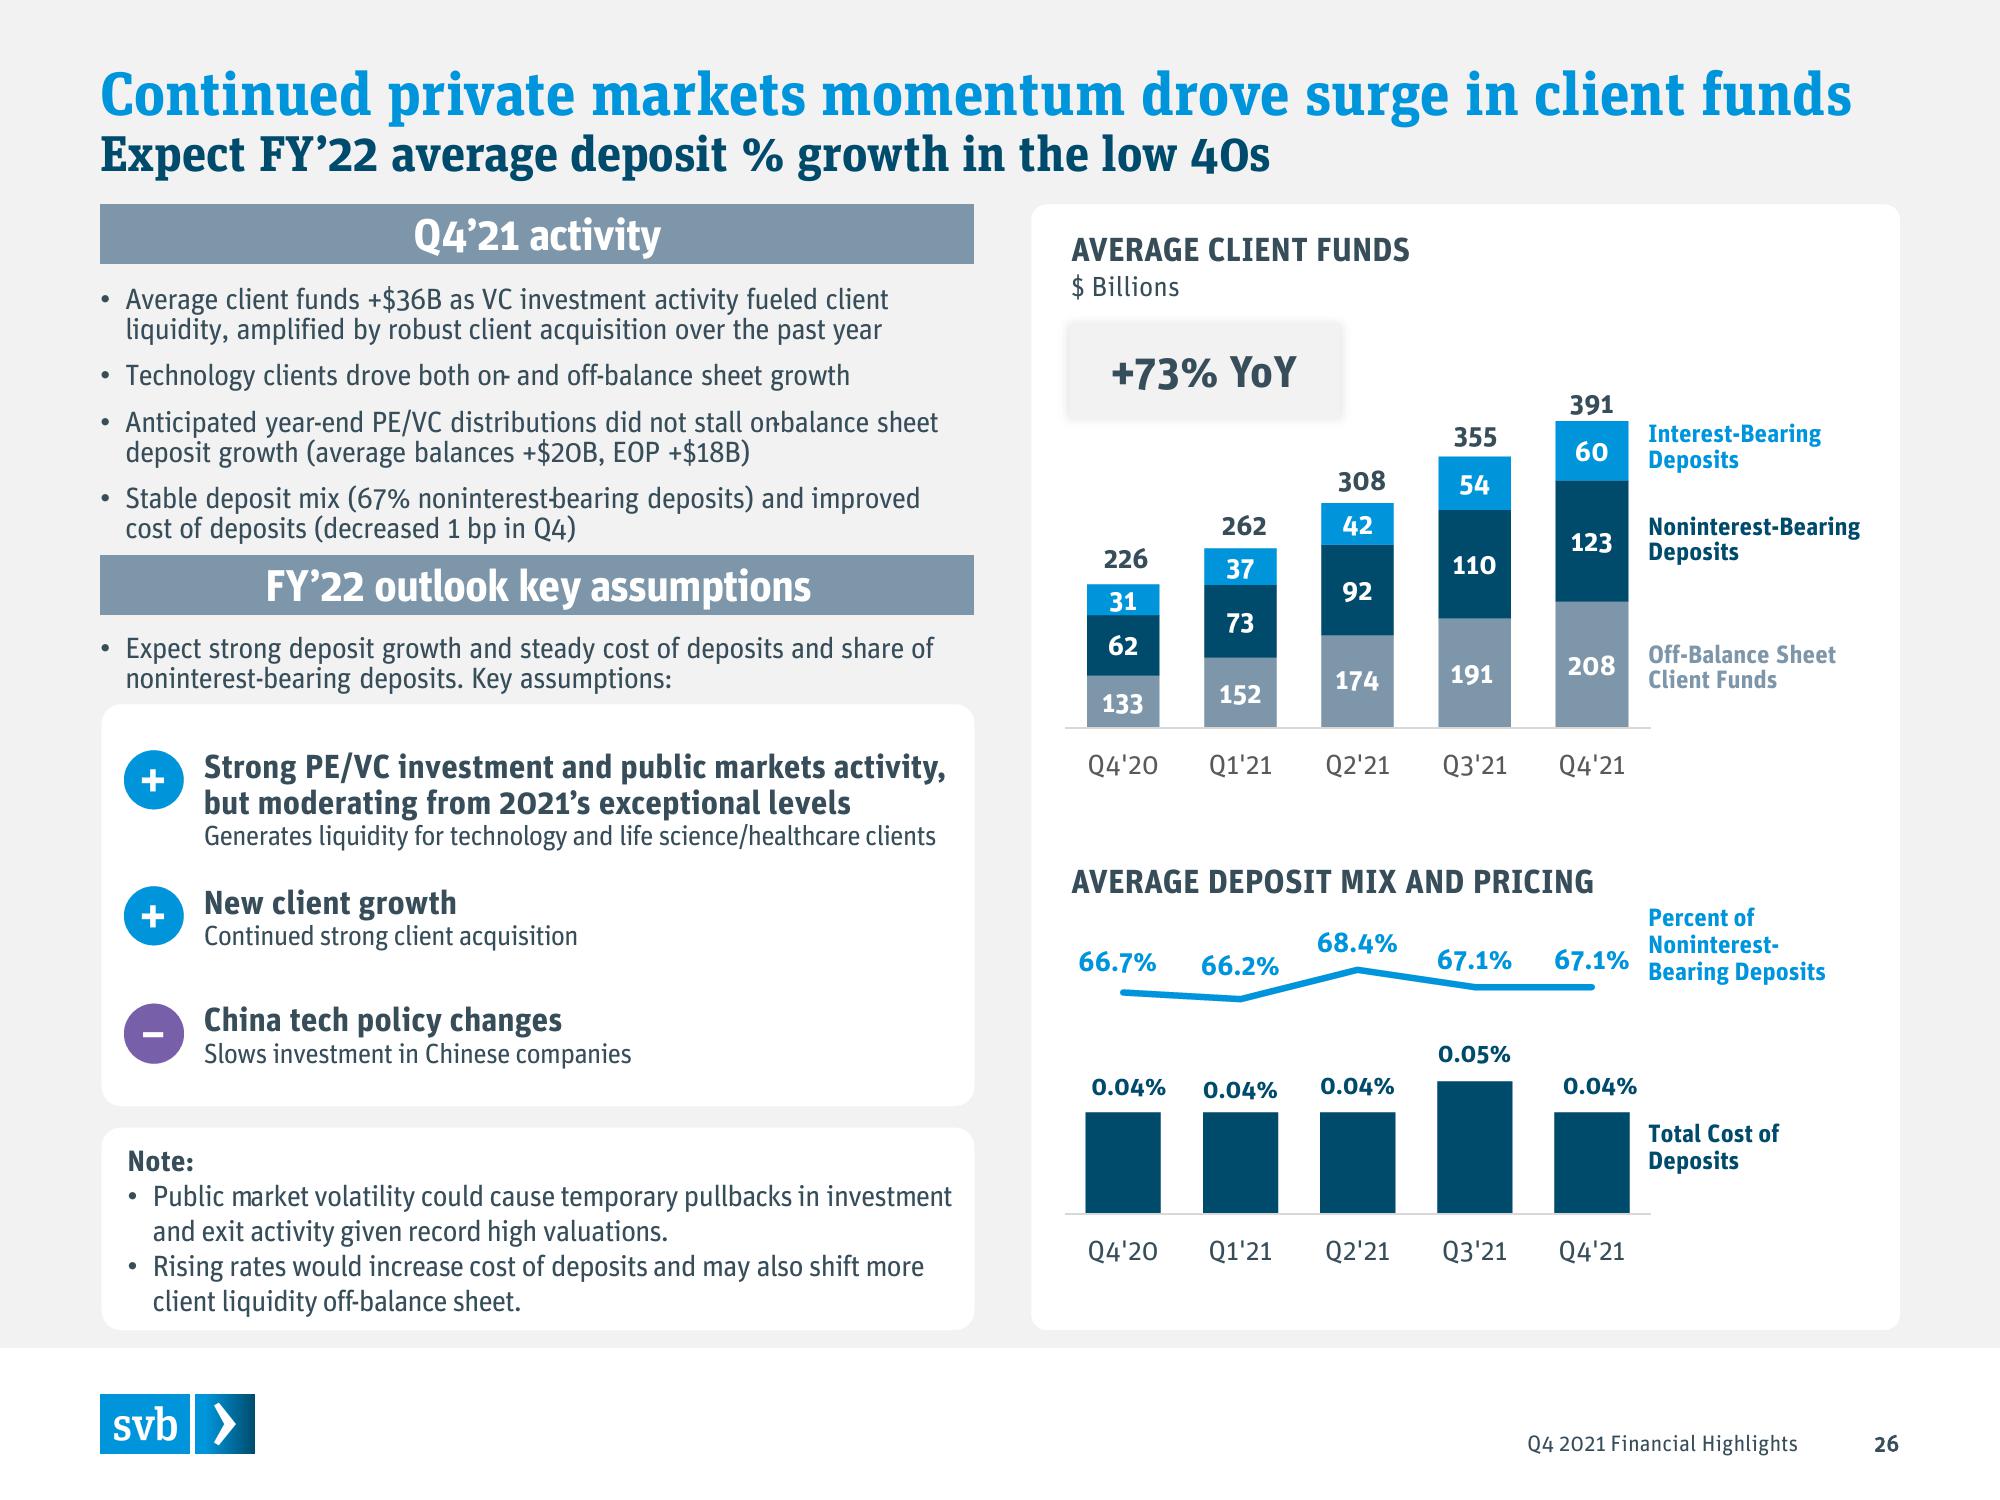
Continued private markets momentum drove surge in client funds
Expect FY'22 average deposit % growth in the low 40s
●
●
●
●
Q4'21 activity
Average client funds +$36B as VC investment activity fueled client
liquidity, amplified by robust client acquisition over the past year
Technology clients drove both on and off-balance sheet growth
Anticipated year-end PE/VC distributions did not stall onbalance sheet
deposit growth (average balances +$20B, EOP +$18B)
Stable deposit mix (67% noninterest-bearing deposits) and improved
cost of deposits (decreased 1 bp in Q4)
FY'22 outlook key assumptions
Expect strong deposit growth and steady cost of deposits and share of
noninterest-bearing deposits. Key assumptions:
+Strong PE/VC investment and public markets activity,
but moderating from 2021's exceptional levels
Generates liquidity for technology and life science/healthcare clients
+
New client growth
Continued strong client acquisition
China tech policy changes
Slows investment in Chinese companies
Note:
Public market volatility could cause temporary pullbacks in investment
and exit activity given record high valuations.
• Rising rates would increase cost of deposits and may also shift more
client liquidity off-balance sheet.
svb >
AVERAGE CLIENT FUNDS
$Billions
+73% YoY
226
31
62
133
262
37
73
152
308
42
66.7% 66.2%
92
174
Q4'20 Q1'21
Q4'20 Q1'21 Q2'21 Q3'21
68.4%
0.04% 0.04% 0.04%
355
54
110
Q2¹21
191
AVERAGE DEPOSIT MIX AND PRICING
67.1%
0.05%
391
60
Q3'21
123
208
Q4'21
0.04%
Interest-Bearing
Deposits
Q4'21
Noninterest-Bearing
Deposits
Percent of
Noninterest-
67.1% Bearing Deposits
Off-Balance Sheet
Client Funds
Total Cost of
Deposits
Q4 2021 Financial Highlights
26View entire presentation