Apollo Global Management Investor Presentation Deck
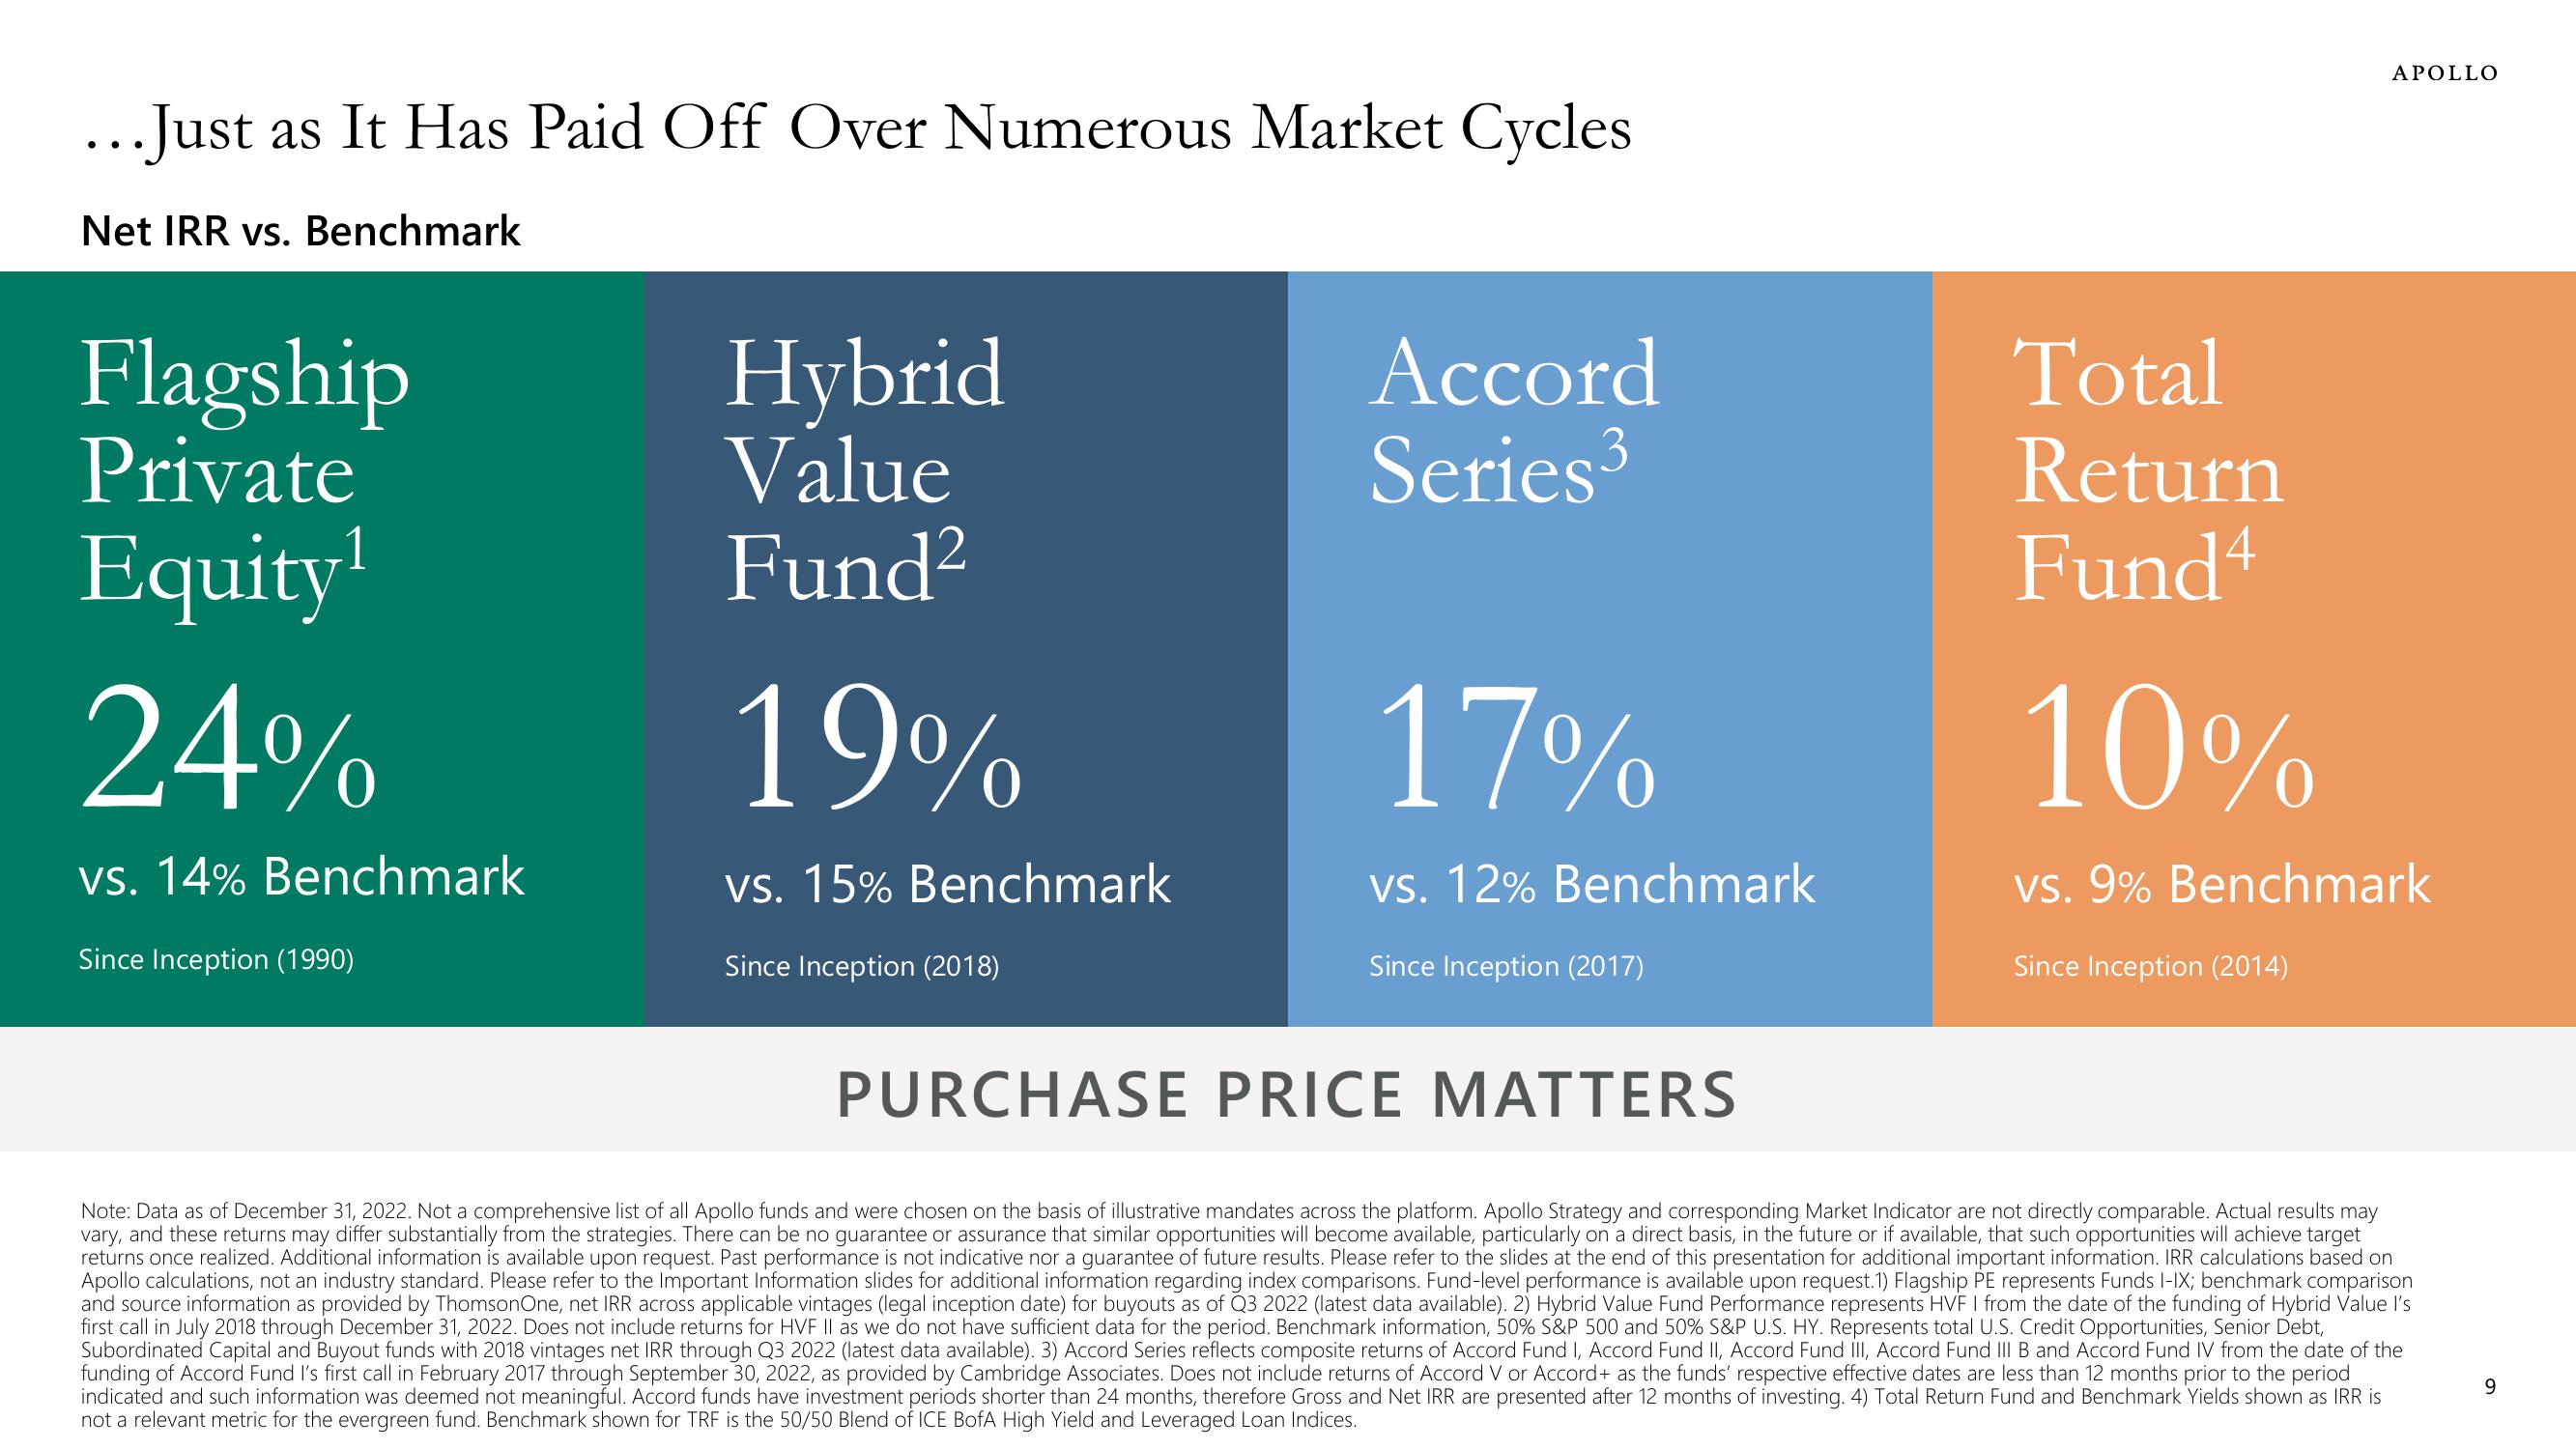
...Just as It Has Paid Off Over Numerous Market Cycles
Net IRR vs. Benchmark
Flagship
Private
Equity¹
Hybrid
Value
Fund²
24%
vs. 14% Benchmark
Since Inception (1990)
Accord
Series³
19%
vs. 15% Benchmark
Since Inception (2018)
Total
Return
Fund4
17%
vs. 12% Benchmark
Since Inception (2017)
PURCHASE PRICE MATTERS
Note: Data as of December 31, 2022. Not a comprehensive list of all Apollo funds and were chosen on the basis of illustrative mandates across the platform. Apollo Strategy and corresponding Market Indicator are not directly comparable. Actual results may
vary, and these returns may differ substantially from the strategies. There can be no guarantee or assurance that similar opportunities will become available, particularly on a direct basis, in the future or if available, that such opportunities will achieve target
returns once realized. Additional information is available upon request. Past performance is not indicative nor a guarantee of future results. Please refer to the slides at the end of this presentation for additional important information. IRR calculations based on
Apollo calculations, not an industry standard. Please refer to the Important Information slides for additional information regarding index comparisons. Fund-level performance is available upon request.1) Flagship PE represents Funds I-IX; benchmark comparison
and source information as provided by ThomsonOne, net IRR across applicable vintages (legal inception date) for buyouts as of Q3 2022 (latest data available). 2) Hybrid Value Fund Performance represents HVF I from the date of the funding of Hybrid Value I's
first call in July 2018 through December 31, 2022. Does not include returns for HVF II as we do not have sufficient data for the period. Benchmark information, 50% S&P 500 and 50% S&P U.S. HY. Represents total U.S. Credit Opportunities, Senior Debt,
Subordinated Capital and Buyout funds with 2018 vintages net IRR through Q3 2022 (latest data available). 3) Accord Series reflects composite returns of Accord Fund I, Accord Fund II, Accord Fund III, Accord Fund III B and Accord Fund IV from the date of the
funding of Accord Fund I's first call in February 2017 through September 30, 2022, as provided by Cambridge Associates. Does not include returns of Accord V or Accord+ as the funds' respective effective dates are less than 12 months prior to the period
indicated and such information was deemed not meaningful. Accord funds have investment periods shorter than 24 months, therefore Gross and Net IRR are presented after 12 months of investing. 4) Total Return Fund and Benchmark Yields shown as IRR is
not a relevant metric for the evergreen fund. Benchmark shown for TRF is the 50/50 Blend of ICE BofA High Yield and Leveraged Loan Indices.
APOLLO
10%
vs. 9% Benchmark
Since Inception (2014)
9View entire presentation