Silicon Valley Bank Results Presentation Deck
Long-term tailwinds supporting the innovation economy remain intact
Attractive
long-term growth
opportunity +
acceleration of
digital
Significant dry
powder to
support future
investment
svb>
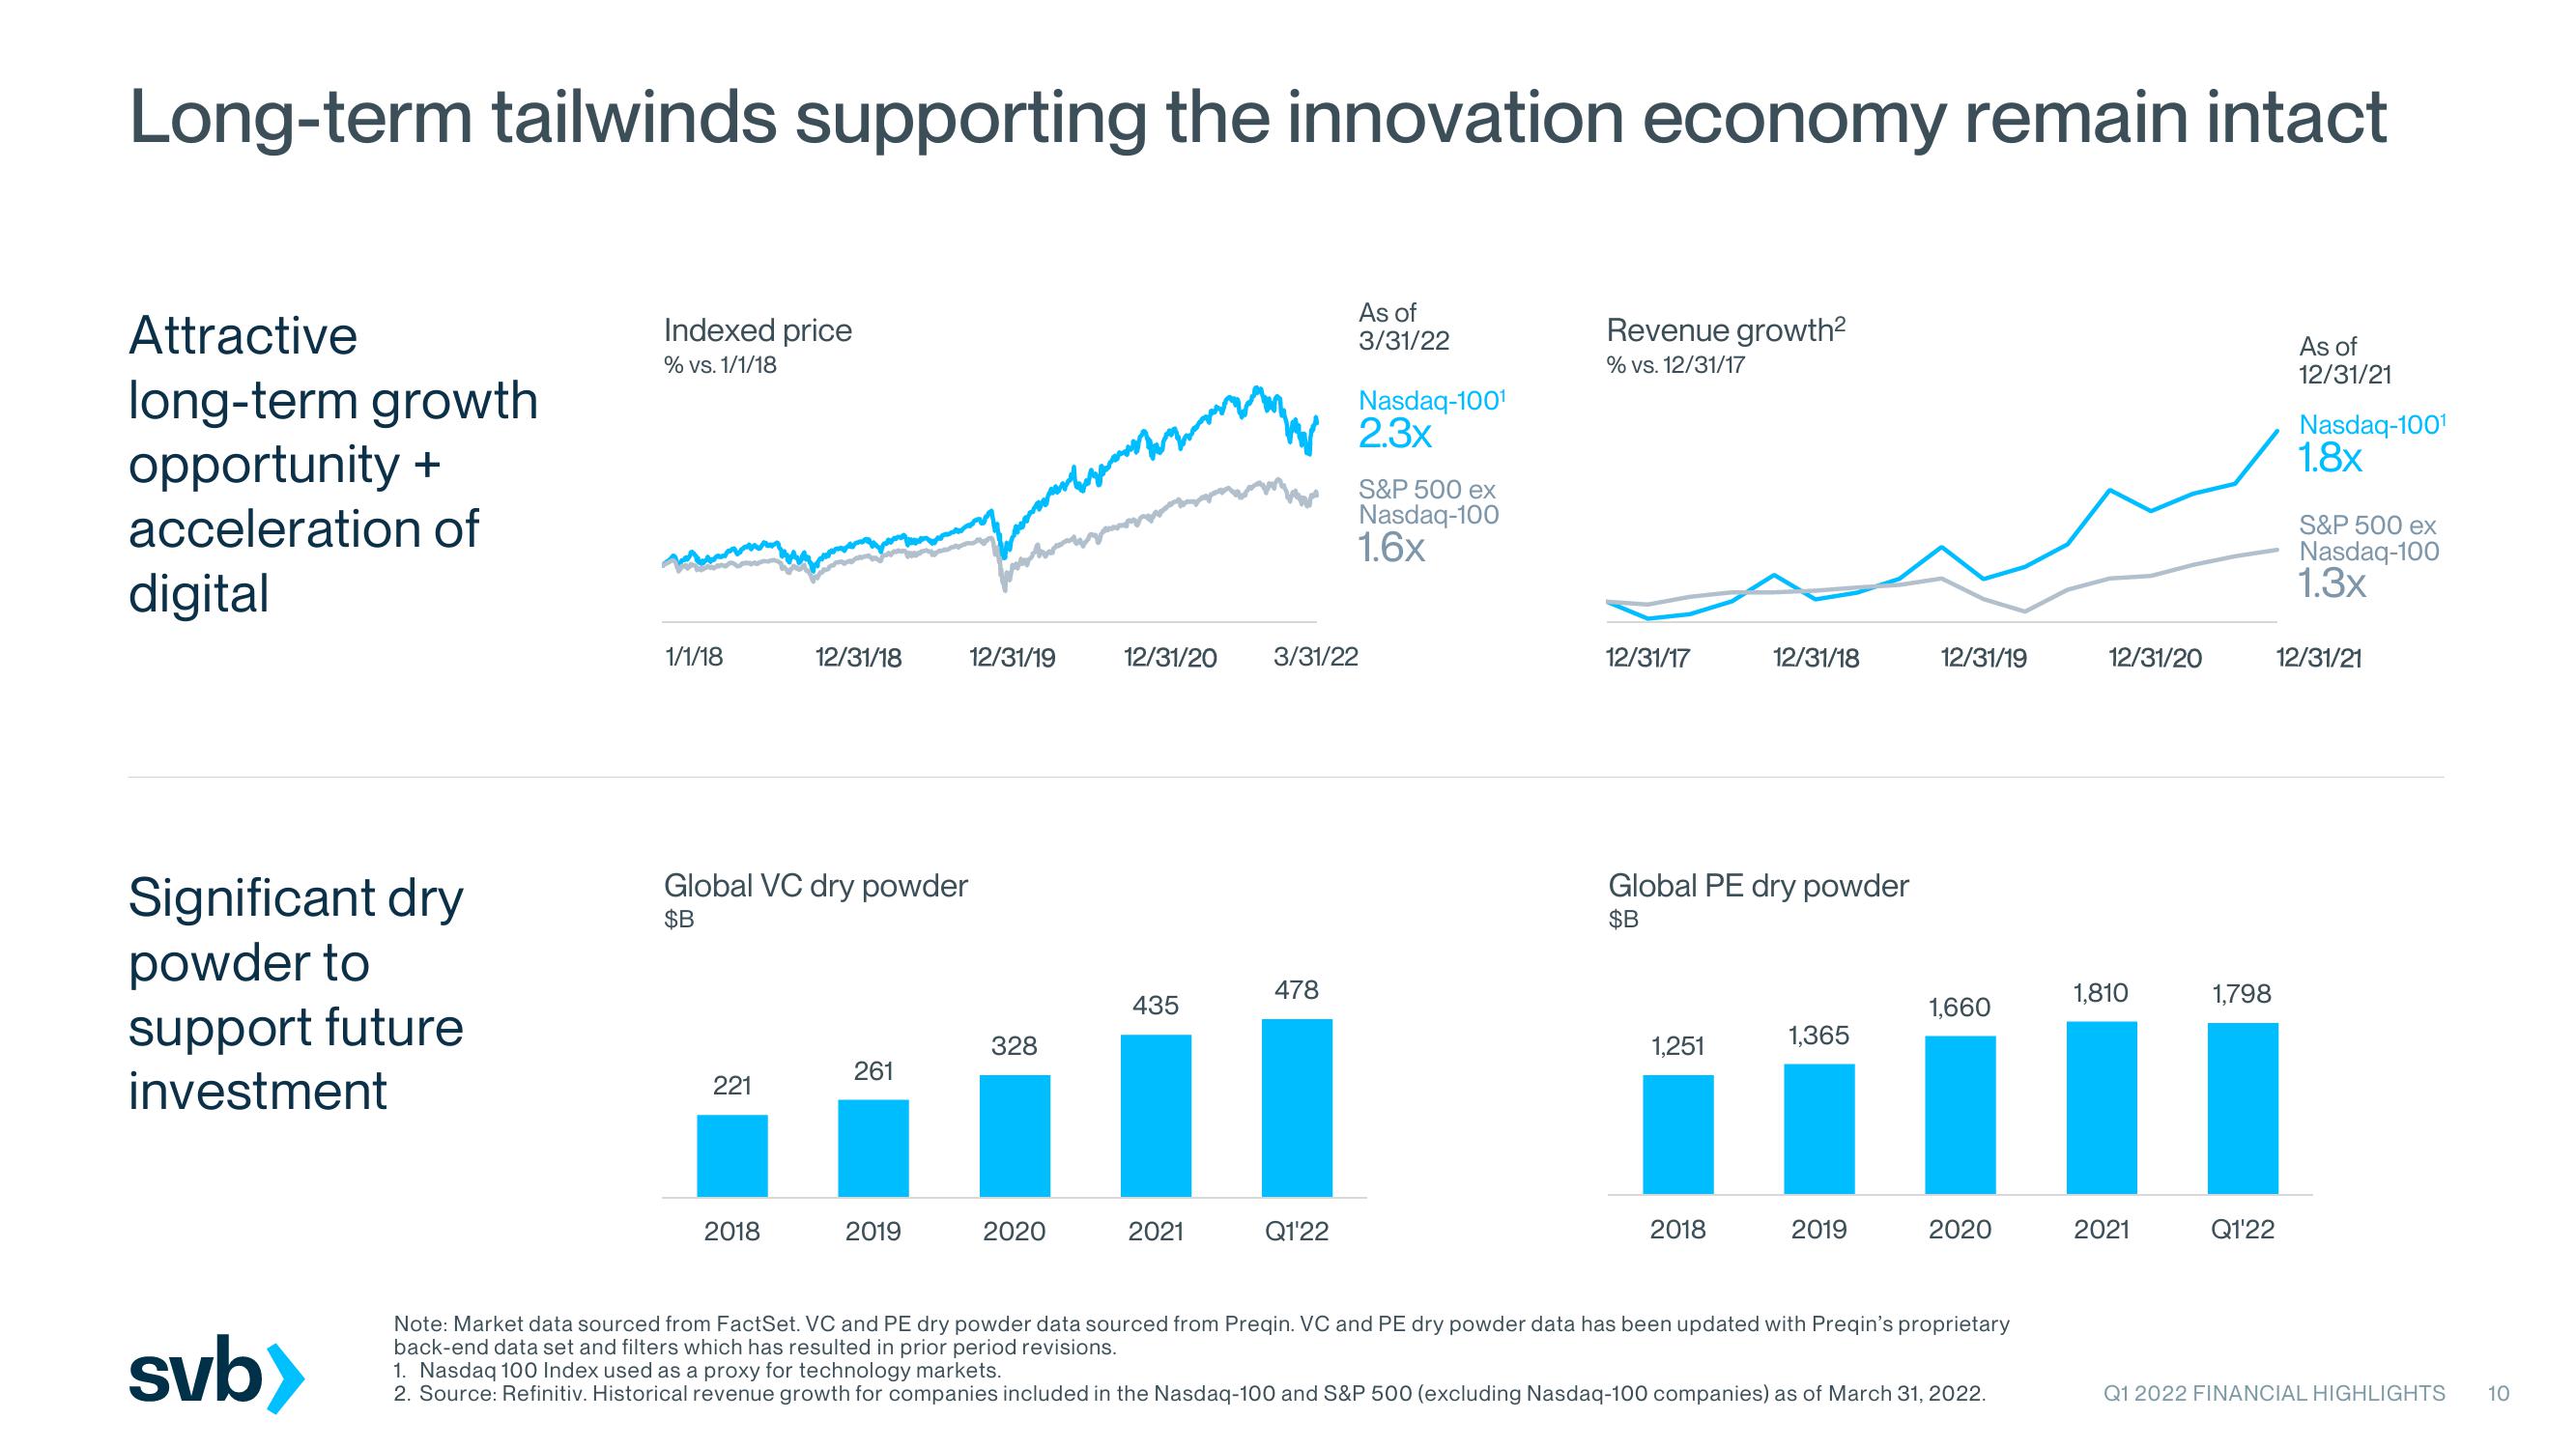
Indexed price
% vs. 1/1/18
1/1/18
Global VC dry powder
$B
221
12/31/18
2018
261
2019
12/31/19
328
2020
12/31/20
435
2021
478
As of
3/31/22
Q1'22
Nasdaq-1001
2.3x
3/31/22
S&P 500 ex
Nasdaq-100
1.6x
Revenue growth²
% vs. 12/31/17
12/31/17
Global PE dry powder
$B
1,251
12/31/18
2018
1,365
2019
12/31/19
1,660
2020
Note: Market data sourced from FactSet. VC and PE dry powder data sourced from Preqin. VC and PE dry powder data has been updated with Preqin's proprietary
back-end data set and filters which has resulted in prior period revisions.
1. Nasdaq 100 Index used as a proxy for technology markets.
2. Source: Refinitiv. Historical revenue growth for companies included in the Nasdaq-100 and S&P 500 (excluding Nasdaq-100 companies) as of March 31, 2022.
12/31/20
1,810
2021
1,798
As of
12/31/21
Q1'22
Nasdaq-1001
1.8x
S&P 500 ex
Nasdaq-100
1.3x
12/31/21
Q1 2022 FINANCIAL HIGHLIGHTS 10View entire presentation