Silicon Valley Bank Results Presentation Deck
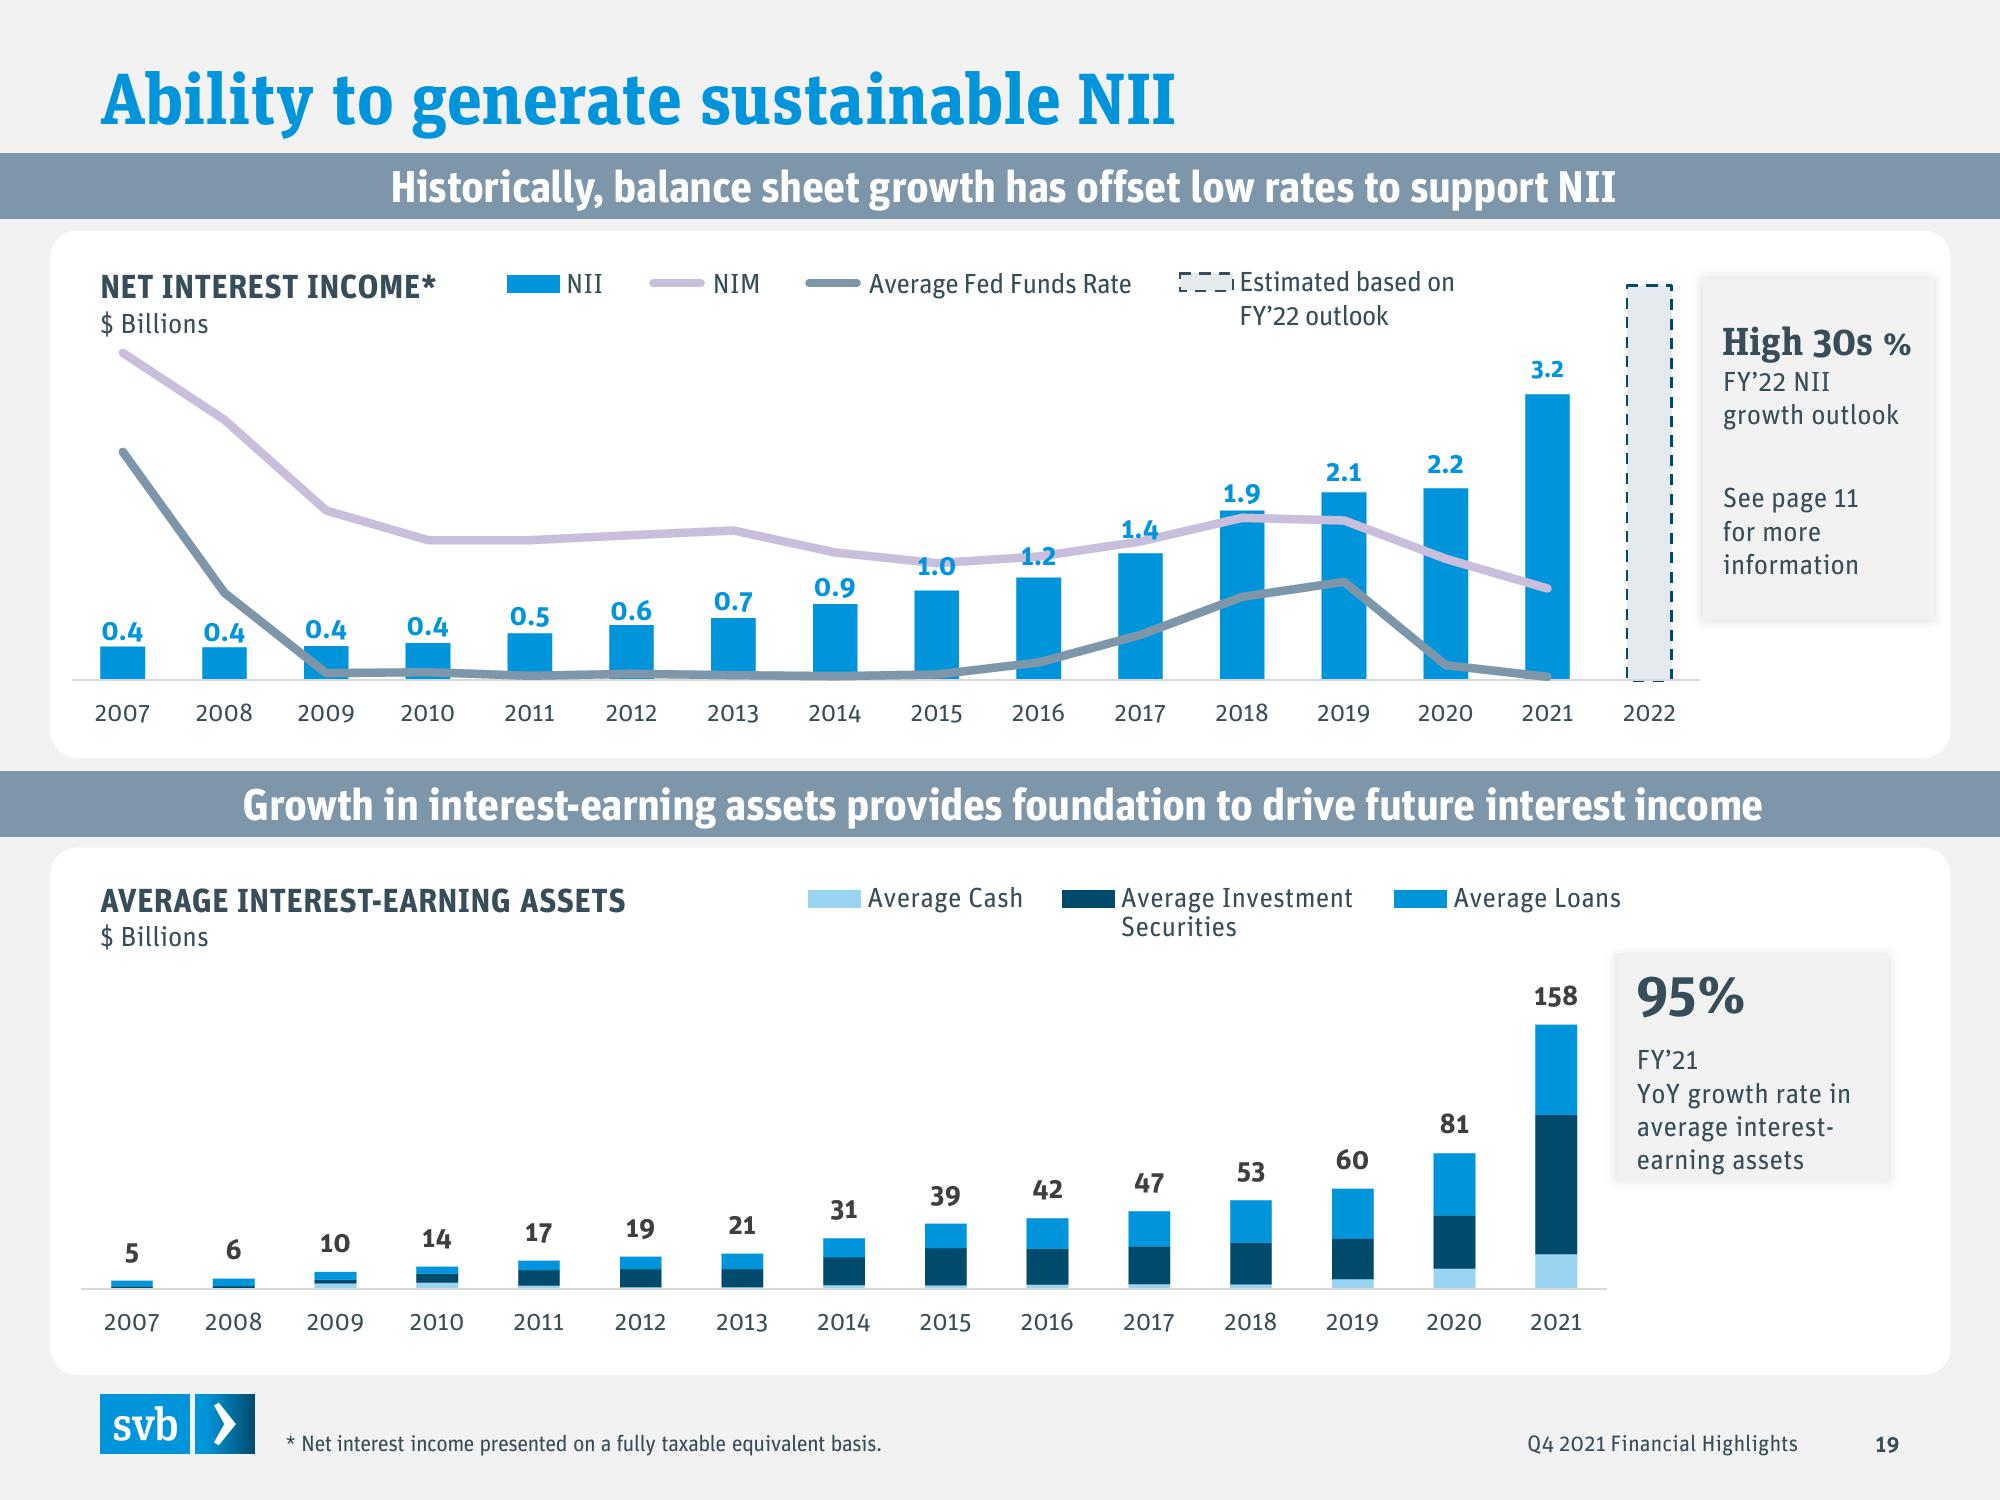
Ability to generate sustainable NII
NET INTEREST INCOME*
$ Billions
0.4
2007
0.4
5
2008
6
0.4
2007 2008
svb >
Historically, balance sheet growth has offset low rates to support NII
0.4
2009 2010
10
AVERAGE INTEREST-EARNING ASSETS
$ Billions
0.5
14
2011
2009 2010
NII
17
0.6
2011
2012
NIM
19
0.7
2013
0.9
21
2014
Average Fed Funds Rate
31
Growth in interest-earning assets provides foundation to drive future interest income
Average Investment
Securities
2012 2013 2014
1.0
* Net interest income presented on a fully taxable equivalent basis.
Average Cash
1.2
39
1.9
+
2015 2016 2017 2018 2019 2020 2021 2022
2015
42
1.4
2016
Estimated based on
FY'22 outlook
47
2.1
53
2.2
60
3.2
Average Loans
81
2017 2018 2019 2020
I
158
2021
High 30s%
FY'22 NII
growth outlook
See page 11
for more
information
95%
FY'21
YoY growth rate in
average interest-
earning assets
Q4 2021 Financial Highlights
19View entire presentation