AstraZeneca Investor Day Presentation Deck
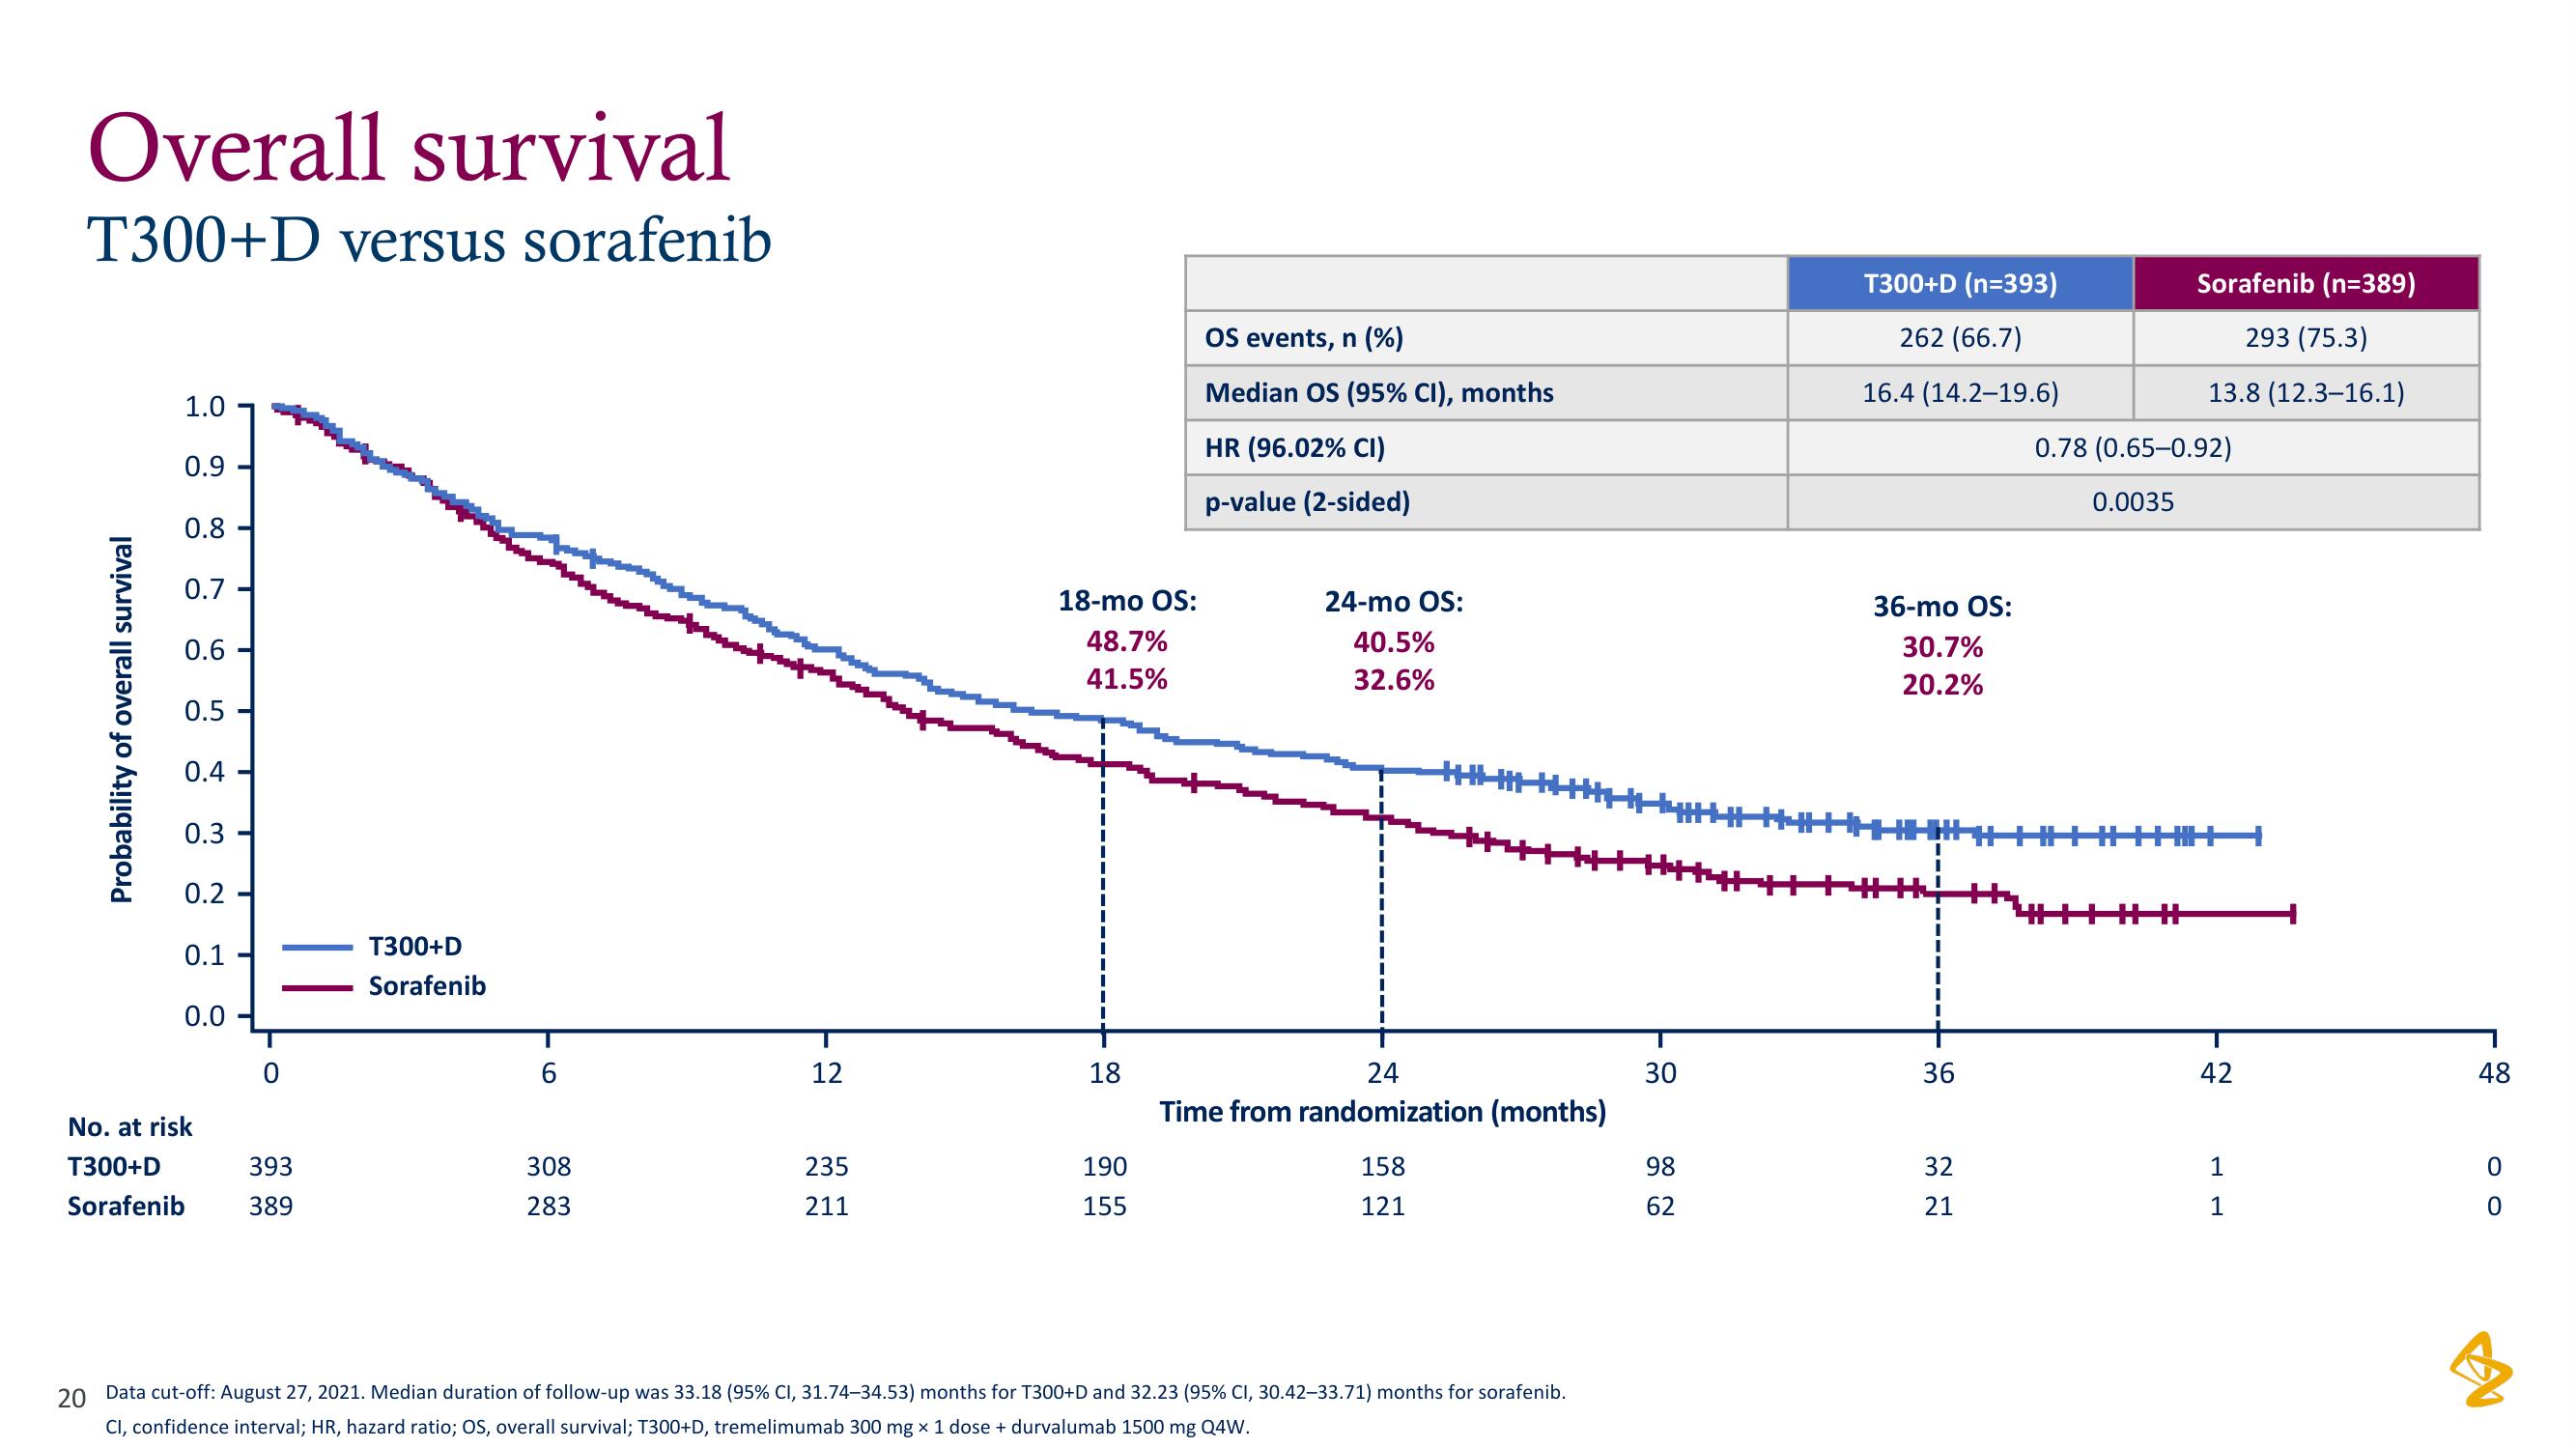
Overall survival
T300+D versus sorafenib
Probability of overall survival
1.0
0.9
0.8
0.7
0.6
0.5
0.4
0.3
0.2
0.1
0.0
No. at risk
T300+D
Sorafenib
393
389
T300+D
Sorafenib
6
308
283
12
235
211
18-mo OS:
48.7%
41.5%
18
190
155
OS events, n (%)
Median OS (95% CI), months
HR (96.02% CI)
p-value (2-sided)
24-mo OS:
40.5%
32.6%
I
24
Time from randomization (months)
158
121
20 Data cut-off: August 27, 2021. Median duration of follow-up was 33.18 (95% CI, 31.74-34.53) months for T300+D and 32.23 (95% CI, 30.42-33.71) months for sorafenib.
CI, confidence interval; HR, hazard ratio; OS, overall survival; T300+D, tremelimumab 300 mg x 1 dose + durvalumab 1500 mg Q4W.
30
98
62
T300+D (n=393)
262 (66.7)
16.4 (14.2-19.6)
36-mo OS:
30.7%
20.2%
36
32
21
0.78 (0.65-0.92)
0.0035
Sorafenib (n=389)
293 (75.3)
13.8 (12.3-16.1)
##
42
1
1
48
OO
0
0
BView entire presentation