Silicon Valley Bank Results Presentation Deck
FY'21 Snapshot: Record earnings and growth supported by thriving
markets and effective execution
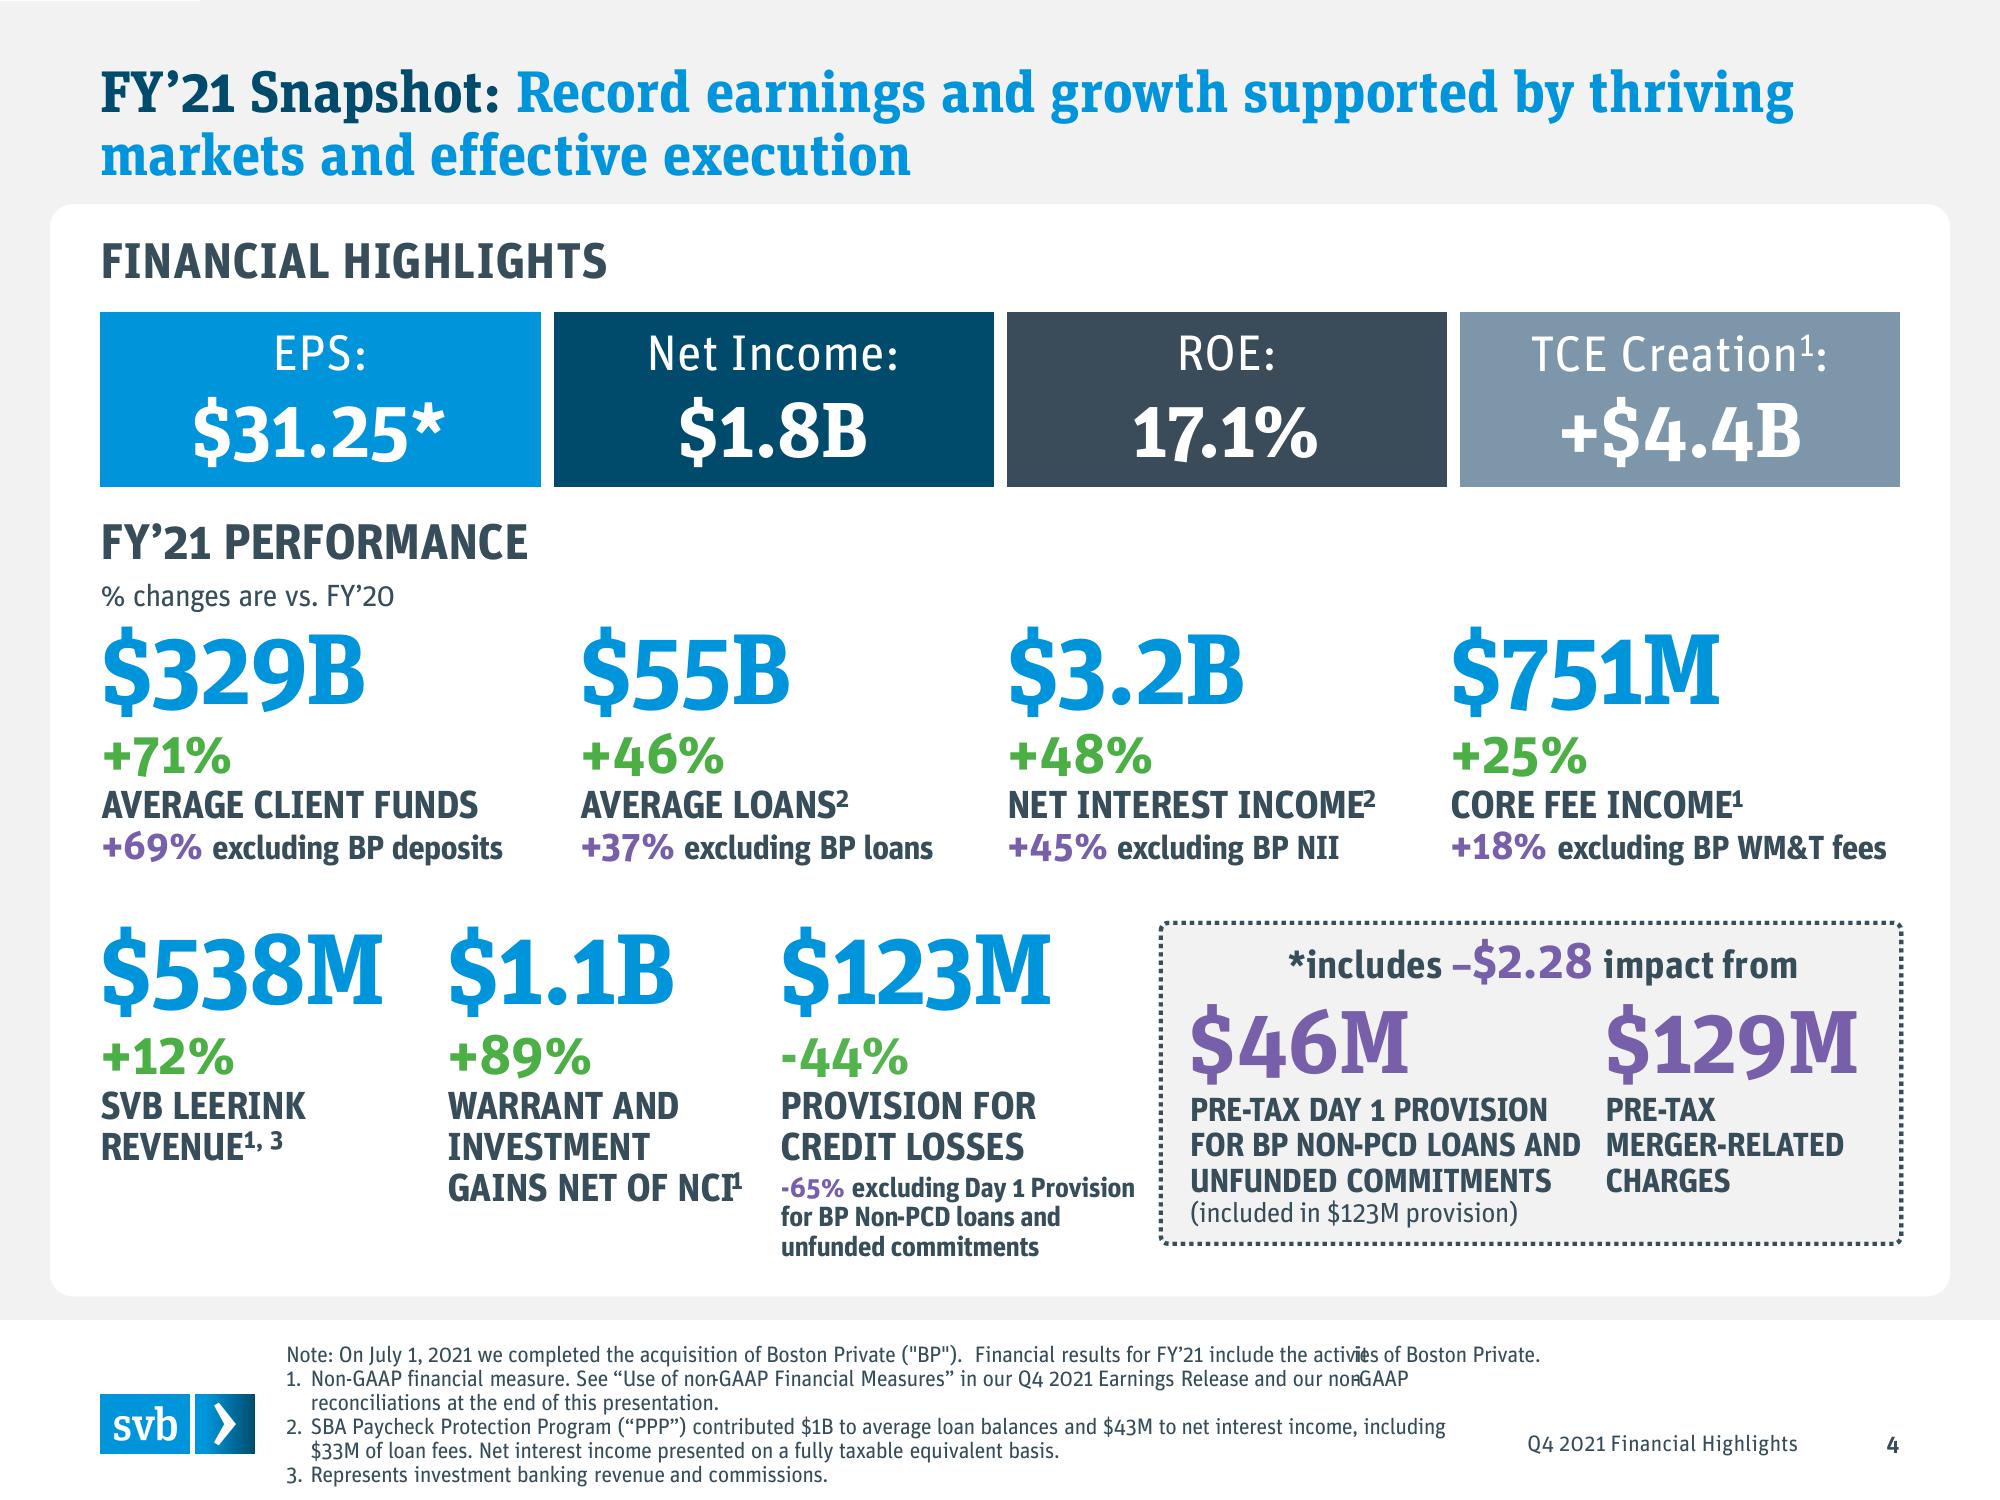
FINANCIAL HIGHLIGHTS
EPS:
$31.25*
FY'21 PERFORMANCE
% changes are vs. FY'20
$329B
+71%
AVERAGE CLIENT FUNDS
+69% excluding BP deposits
+12%
SVB LEERINK
REVENUE¹, 3
Net Income:
$1.8B
$538M $1.1B
+89%
WARRANT AND
INVESTMENT
GAINS NET OF NCT¹
svb>
$55B
+46%
AVERAGE LOANS²
+37% excluding BP loans
ROE:
17.1%
$3.2B
+48%
NET INTEREST INCOME²
+45% excluding BP NII
$123M
-44%
PROVISION FOR
CREDIT LOSSES
-65% excluding Day 1 Provision
for BP Non-PCD loans and
unfunded commitments
TCE Creation ¹:
+$4.4B
$751M
+25%
CORE FEE INCOME¹
+18% excluding BP WM&T fees
*includes -$2.28 impact from
$46M
PRE-TAX DAY 1 PROVISION
FOR BP NON-PCD LOANS AND
UNFUNDED COMMITMENTS
(included in $123M provision)
Note: On July 1, 2021 we completed the acquisition of Boston Private ("BP"). Financial results for FY'21 include the activies of Boston Private.
1. Non-GAAP financial measure. See "Use of non-GAAP Financial Measures" in our Q4 2021 Earnings Release and our no-GAAP
reconciliations at the end of this presentation.
2. SBA Paycheck Protection Program ("PPP") contributed $1B to average loan balances and $43M to net interest income, including
$33M of loan fees. Net interest income presented on a fully taxable equivalent basis.
3. Represents investment banking revenue and commissions.
$129M
PRE-TAX
MERGER-RELATED
CHARGES
Q4 2021 Financial Highlights
4View entire presentation