Silicon Valley Bank Results Presentation Deck
Strong PE/VC investment activity continued to drive robust loan growth
Increased FY'22 average loan growth outlook to low 30s %
Q4'21 activity
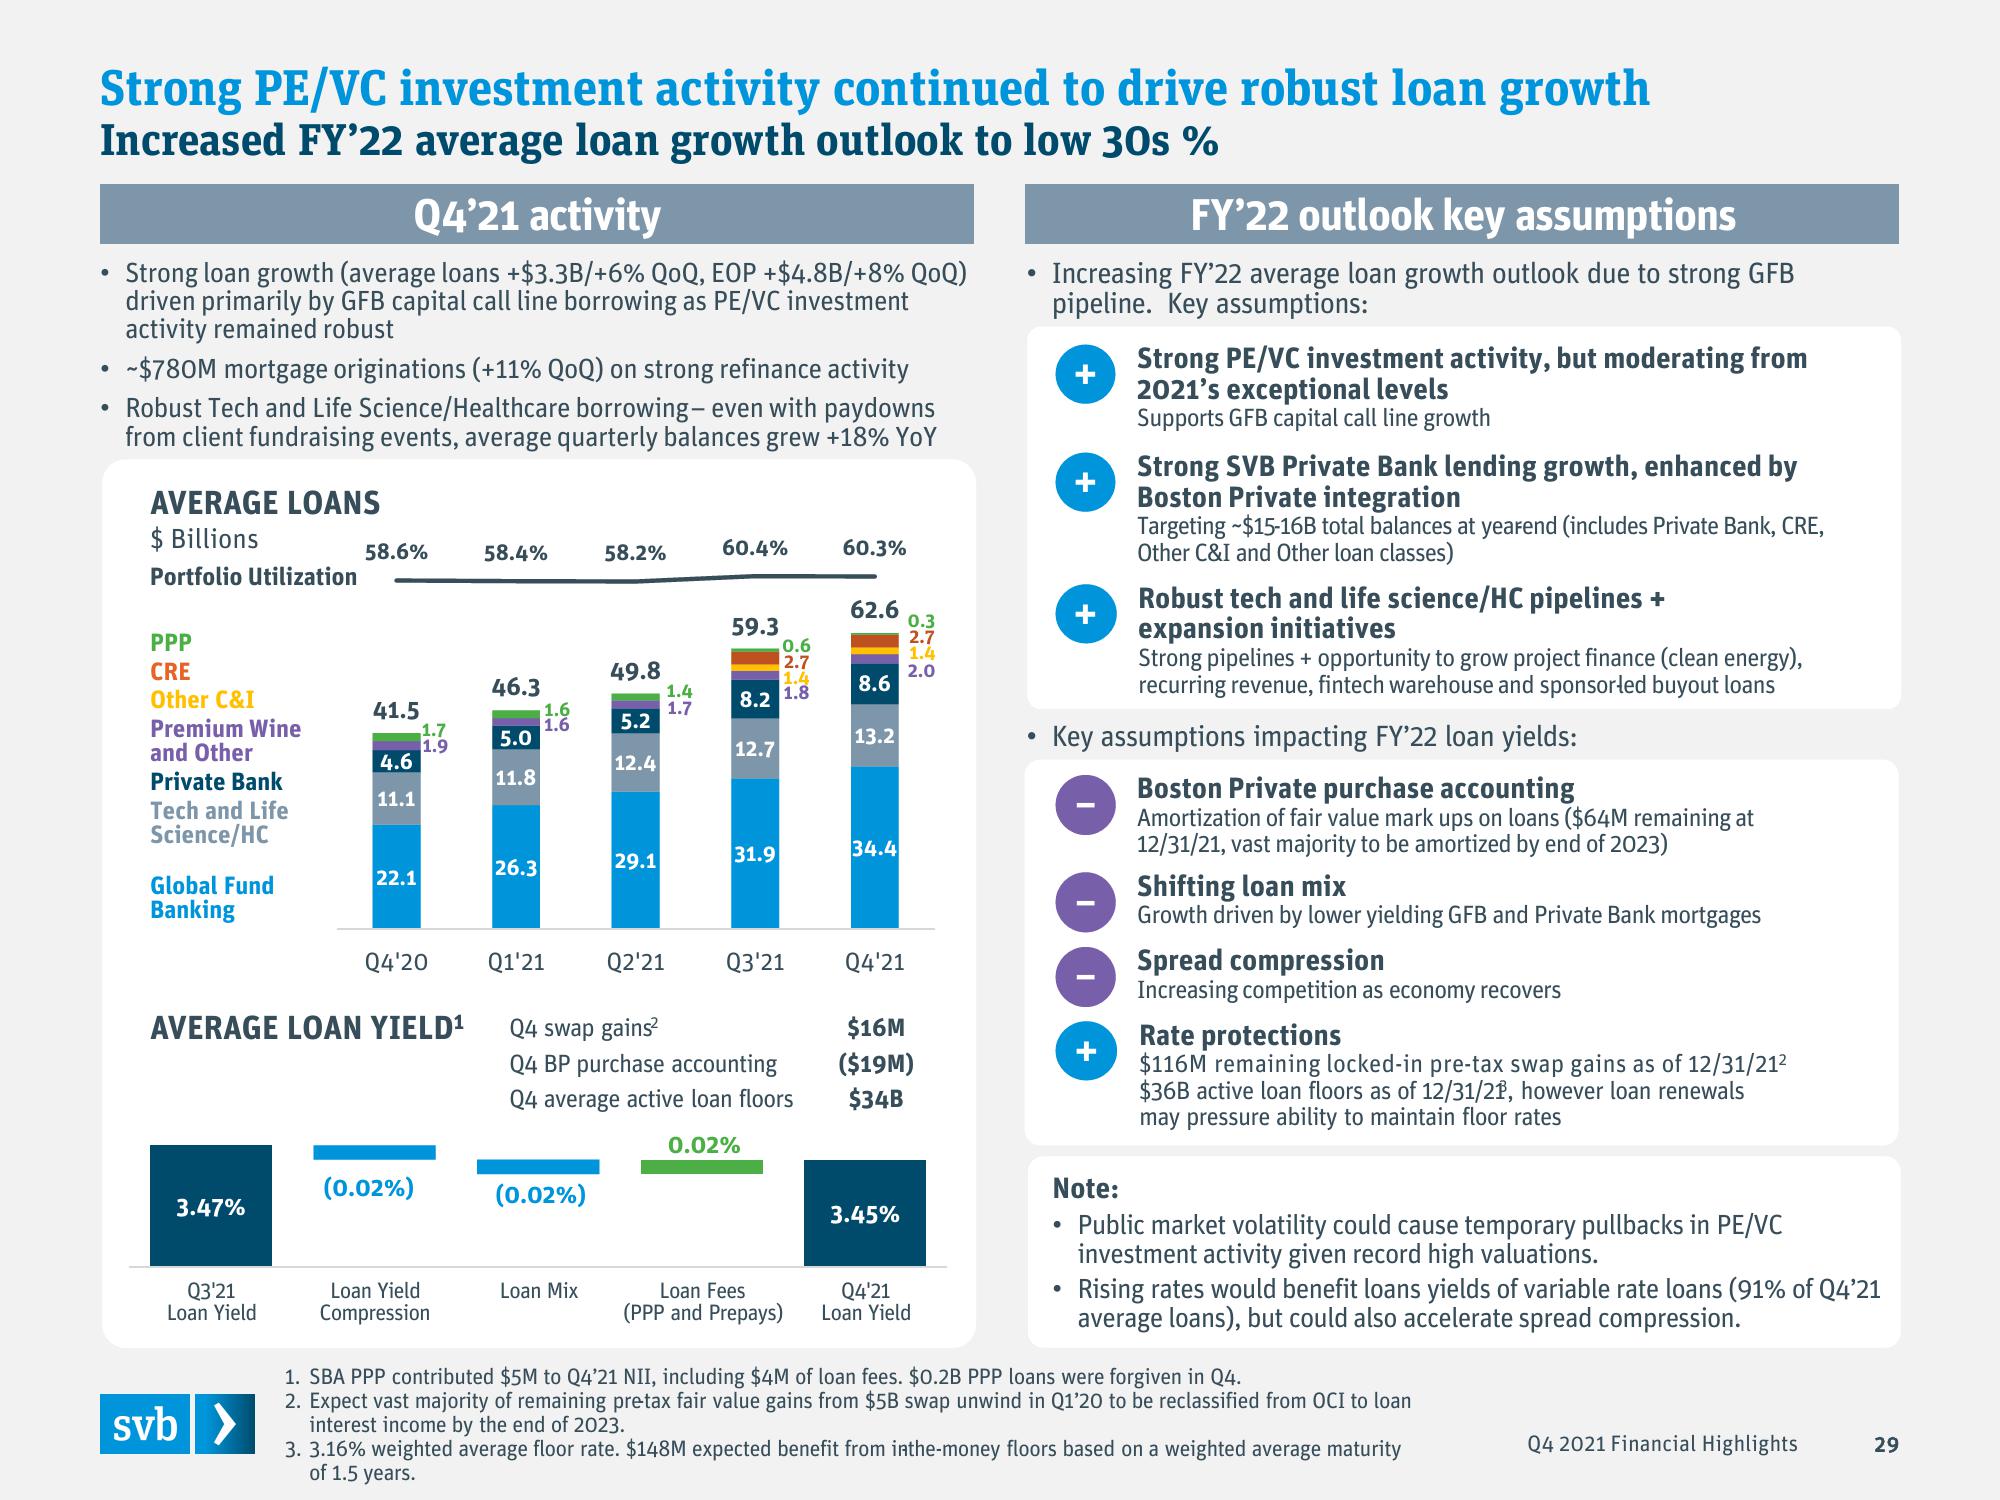
Strong loan growth (average loans +$3.3B/+6% QOQ, EOP +$4.8B/+8% QoQ)
driven primarily by GFB capital call line borrowing as PE/VC investment
activity remained robust
• ~$780M mortgage originations (+11% QoQ) on strong refinance activity
Robust Tech and Life Science/Healthcare borrowing- even with paydowns
from client fundraising events, average quarterly balances grew +18% YoY
●
AVERAGE LOANS
$ Billions
Portfolio Utilization
PPP
CRE
Other C&I
Premium Wine
and Other
Private Bank
Tech and Life
Science/HC
Global Fund
Banking
3.47%
Q3'21
Loan Yield
58.6%
svb >
41.5
4.6
11.1
22.1
AVERAGE LOAN YIELD¹
1.7
Q4'20
(0.02%)
79
1.9
Loan Yield
Compression
58.4%
46.3
5.0
11.8
26.3
1.6
1.6
Q1'21
(0.02%)
58.2%
Loan Mix
49.8
5.2
12.4
29.1
Q2'21
1.4
1.7
60.4%
59.3
8.2
12.7
31.9
0.6
2.7
1.4
1.8
Q4 swap gains²
Q4 BP purchase accounting
Q4 average active loan floors
0.02%
Q3'21
Loan Fees
(PPP and Prepays)
60.3%
62.6
8.6
13.2
34.4
Q4'21
0.3
2.7
1.4
2.0
$16M
($19M)
$34B
3.45%
Q4'21
Loan Yield
FY'22 outlook key assumptions
• Increasing FY'22 average loan growth outlook due to strong GFB
pipeline. Key assumptions:
●
+
●
●
Strong PE/VC investment activity, but moderating from
2021's exceptional levels
Supports GFB capital call line growth
+
Strong SVB Private Bank lending growth, enhanced by
Boston Private integration
Targeting -$15-16B total balances at yearend (includes Private Bank, CRE,
Other C&I and Other loan classes)
Key assumptions impacting FY'22 loan yields:
Boston Private purchase accounting
Amortization of fair value mark ups on loans ($64M remaining at
12/31/21, vast majority to be amortized by end of 2023)
Robust tech and life science/HC pipelines +
expansion initiatives
Strong pipelines + opportunity to grow project finance (clean energy),
recurring revenue, fintech warehouse and sponsorled buyout loans
Shifting loan mix
Growth driven by lower yielding GFB and Private Bank mortgages
Spread compression
Increasing competition as economy recovers
Note:
Public market volatility could cause temporary pullbacks in PE/VC
investment activity given record high valuations.
Rising rates would benefit loans yields of variable rate loans (91% of Q4'21
average loans), but could also accelerate spread compression.
Rate protections
$116M remaining locked-in pre-tax swap gains as of 12/31/21²
$36B active loan floors as of 12/31/21, however loan renewals
may pressure ability to maintain floor rates
1. SBA PPP contributed $5M to Q4'21 NII, including $4M of loan fees. $0.2B PPP loans were forgiven in Q4.
2. Expect vast majority of remaining pretax fair value gains from $5B swap unwind in Q1'20 to be reclassified from OCI to loan
interest income by the end of 2023.
3. 3.16% weighted average floor rate. $148M expected benefit from inthe-money floors based on a weighted average maturity
of 1.5 years.
Q4 2021 Financial Highlights
29View entire presentation