Wix Results Presentation Deck
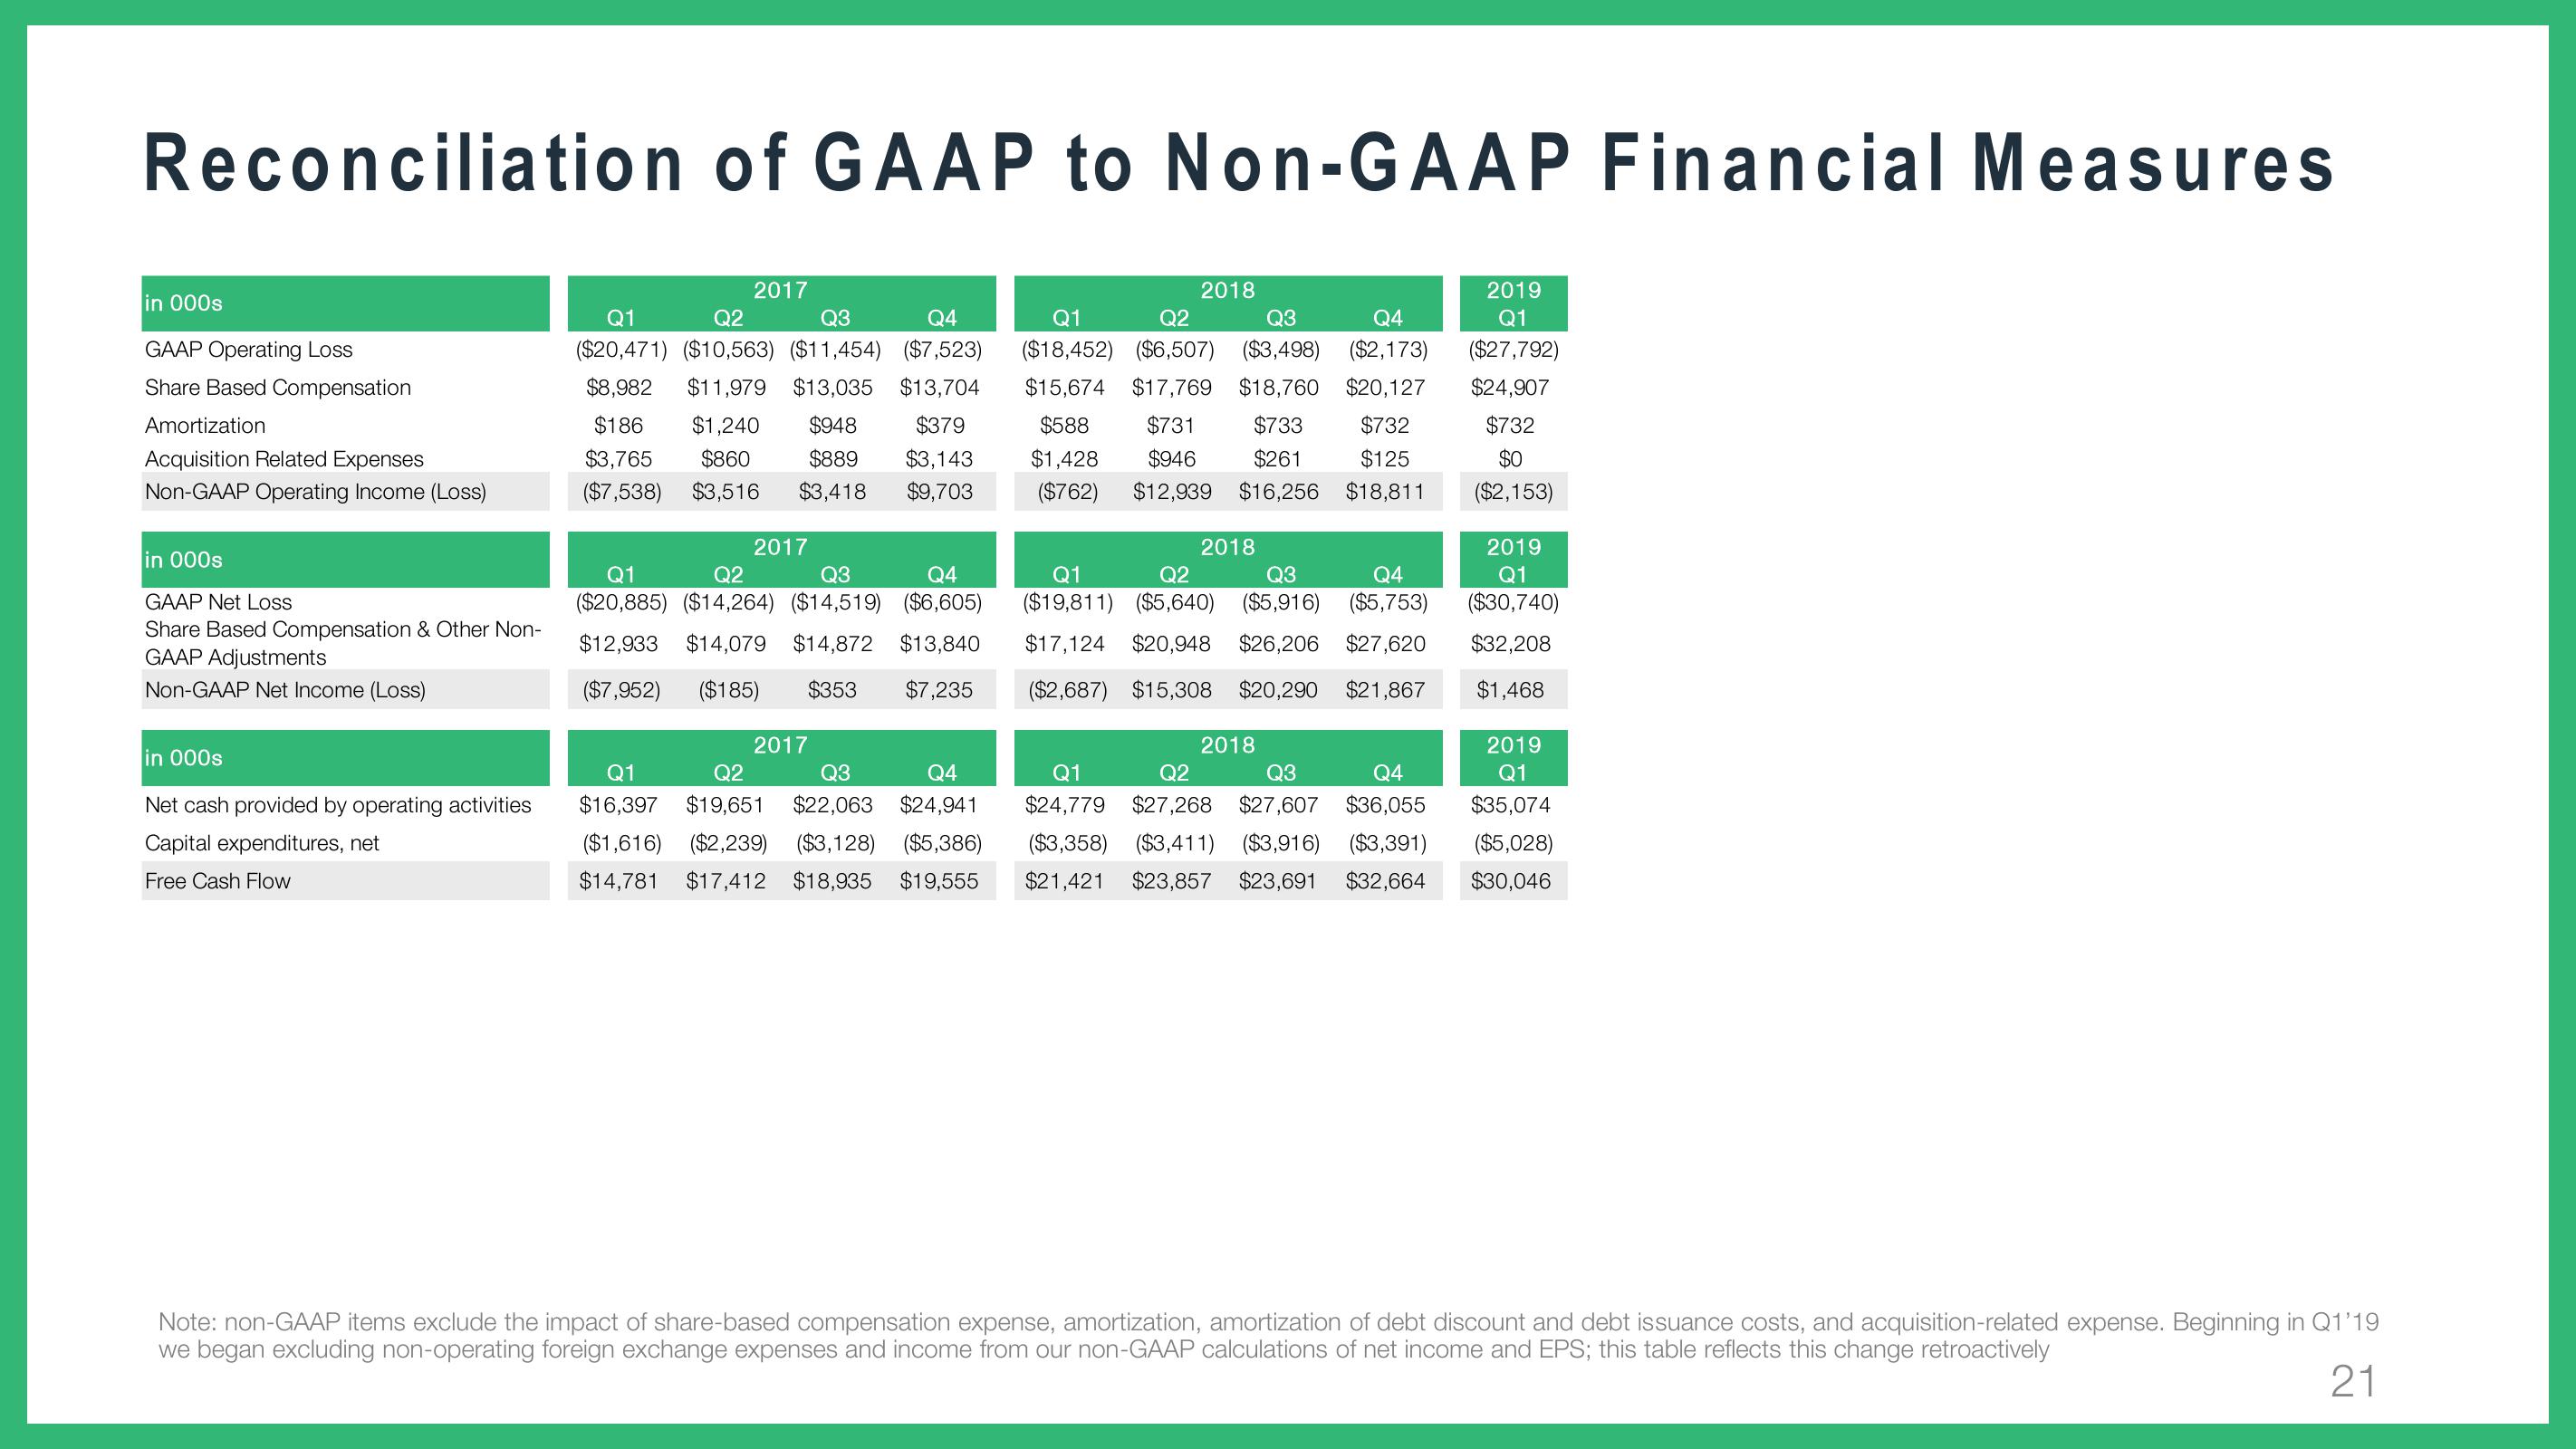
Reconciliation of GAAP to Non-GAAP Financial Measures
in 000s
GAAP Operating Loss
Share Based Compensation
Amortization
Acquisition Related Expenses
Non-GAAP Operating Income (Loss)
in 000s
GAAP Net Loss
Share Based Compensation & Other Non-
GAAP Adjustments
Non-GAAP Net Income (Loss)
in 000s
Net cash provided by operating activities
Capital expenditures, net
Free Cash Flow
2017
Q1
Q4
Q2
Q3
Q1
Q2
Q3
Q4
($20,471) ($10,563) ($11,454) ($7,523) ($18,452) ($6,507) ($3,498) ($2,173)
$8,982 $11,979 $13,035 $13,704 $15,674 $17,769 $18,760 $20,127
$186 $1,240 $948 $379
$588 $731
$733 $732
$3,765 $860 $889 $3,143 $1,428 $946 $261 $125
($7,538) $3,516 $3,418 $9,703 ($762) $12,939 $16,256 $18,811
2017
Q1
Q2
Q3
Q4
($20,885) ($14,264) ($14,519) ($6,605)
$12,933 $14,079 $14,872 $13,840
($7,952) ($185) $353 $7,235
2018
2017
2018
Q1
Q2
Q3
Q4
($19,811) ($5,640) ($5,916) ($5,753)
$17,124 $20,948 $26,206 $27,620
($2,687) $15,308 $20,290 $21,867
2018
2019
Q1
($27,792)
$24,907
$732
$0
($2,153)
2019
Q1
($30,740)
$32,208
$1,468
2019
Q1
$35,074
Q1
Q2
Q3
Q4
Q1
Q2
Q3
Q4
$16,397 $19,651 $22,063 $24,941 $24,779 $27,268 $27,607 $36,055
($1,616) ($2,239) ($3,128) ($5,386) ($3,358) ($3,411) ($3,916) ($3,391) ($5,028)
$14,781 $17,412 $18,935 $19,555 $21,421 $23,857 $23,691 $32,664 $30,046
Note: non-GAAP items exclude the impact of share-based compensation expense, amortization, amortization of debt discount and debt issuance costs, and acquisition-related expense. Beginning in Q1'19
we began excluding non-operating foreign exchange expenses and income from our non-GAAP calculations of net income and EPS; this table reflects this change retroactively
21View entire presentation