Silicon Valley Bank Results Presentation Deck
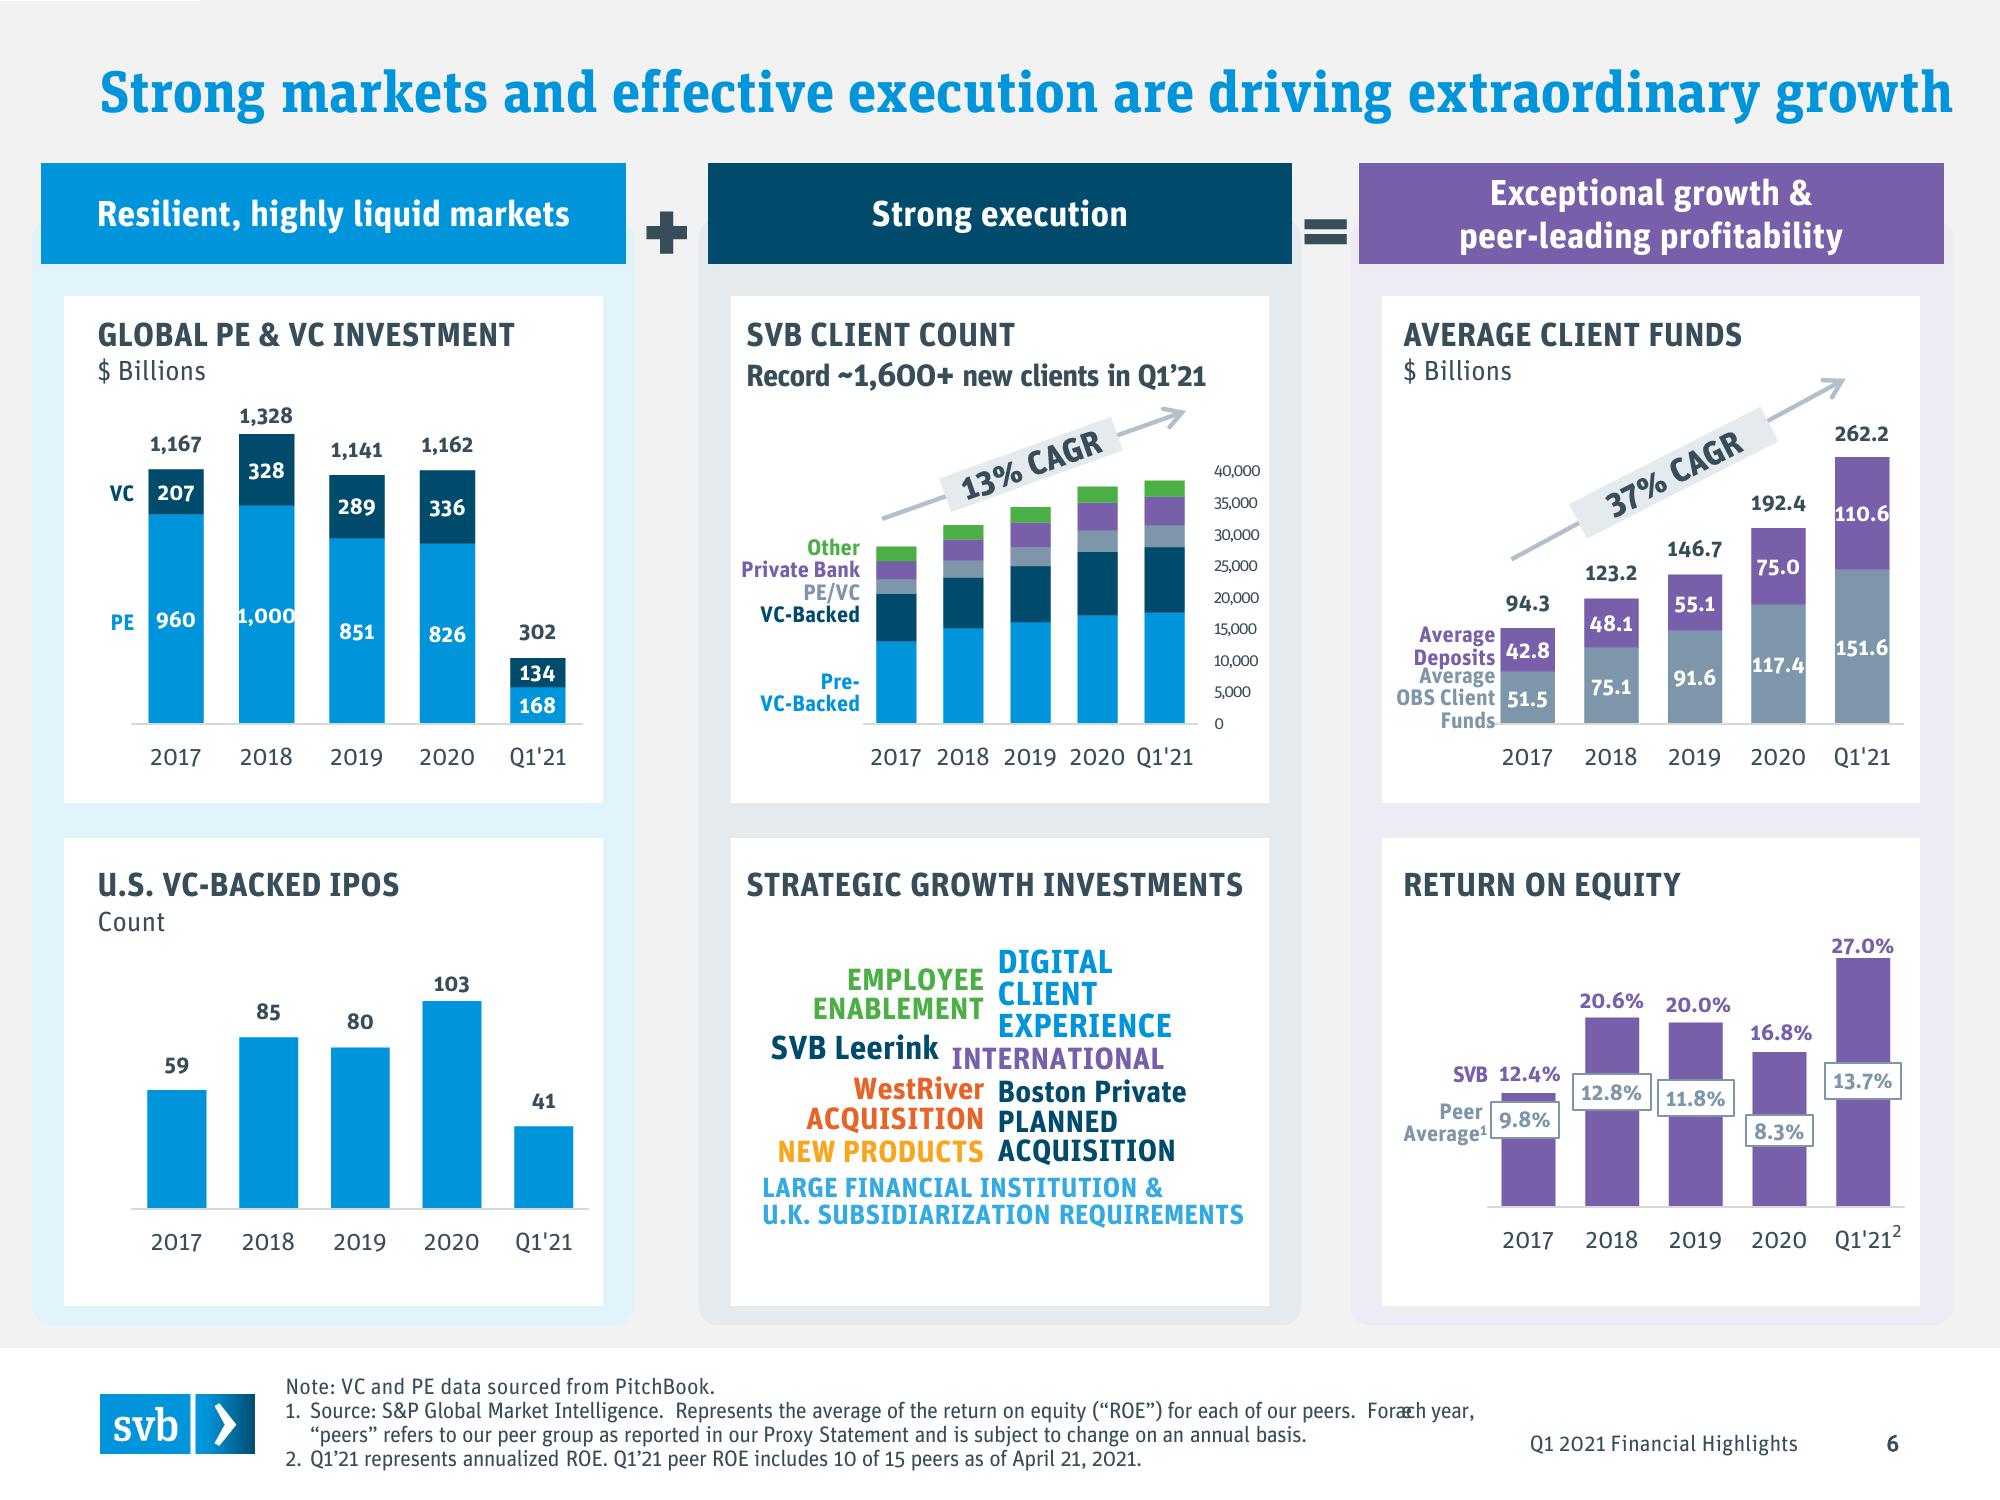
Strong markets and effective execution are driving extraordinary growth
Exceptional growth &
peer-leading profitability
Resilient, highly liquid markets
GLOBAL PE & VC INVESTMENT
$ Billions
1,167
VC 207
1,328
PE 960 1,000
59
328
2017
1,141
U.S. VC-BACKED IPOS
Count
svb >
289
85
851
2017 2018 2019 2020 Q1'21
1,162
80
336
826
302
134
168
103
41
2018 2019 2020 Q1'21
SVB CLIENT COUNT
Record -1,600+ new clients in Q1'21
Other
Private Bank
PE/VC
VC-Backed
Strong execution
Pre-
VC-Backed
13% CAGR
2017 2018 2019 2020 Q1'21
EMPLOYEE
ENABLEMENT
STRATEGIC GROWTH INVESTMENTS
SVB Leerink
40,000
35,000
30,000
25,000
20,000
15,000
10,000
5,000
DIGITAL
CLIENT
0
EXPERIENCE
INTERNATIONAL
WestRiver Boston Private
ACQUISITION PLANNED
NEW PRODUCTS ACQUISITION
LARGE FINANCIAL INSTITUTION &
U.K. SUBSIDIARIZATION REQUIREMENTS
AVERAGE CLIENT FUNDS
$ Billions
94.3
Average
Deposits 42.8
Average
OBS Client 51.5
Funds
SVB 12.4%
Peer
Average¹
Note: VC and PE data sourced from PitchBook.
1. Source: S&P Global Market Intelligence. Represents the average of the return on equity ("ROE") for each of our peers. Forach year,
"peers" refers to our peer group as reported in our Proxy Statement and is subject to change on an annual basis.
2. Q1'21 represents annualized ROE. Q1'21 peer ROE includes 10 of 15 peers as of April 21, 2021.
37% CAGR
9.8%
123.2
2017
48.1
75.1
RETURN ON EQUITY
146.7
2017 2018 2019
55.1
91.6
20.6% 20.0%
12.8% 11.8%
192.4
75.0
117.4
16.8%
8.3%
262.2
2020 Q1'21
110.6
Q1 2021 Financial Highlights
151.6
27.0%
13.7%
2018 2019 2020 Q1'21²
6View entire presentation