Silicon Valley Bank Results Presentation Deck
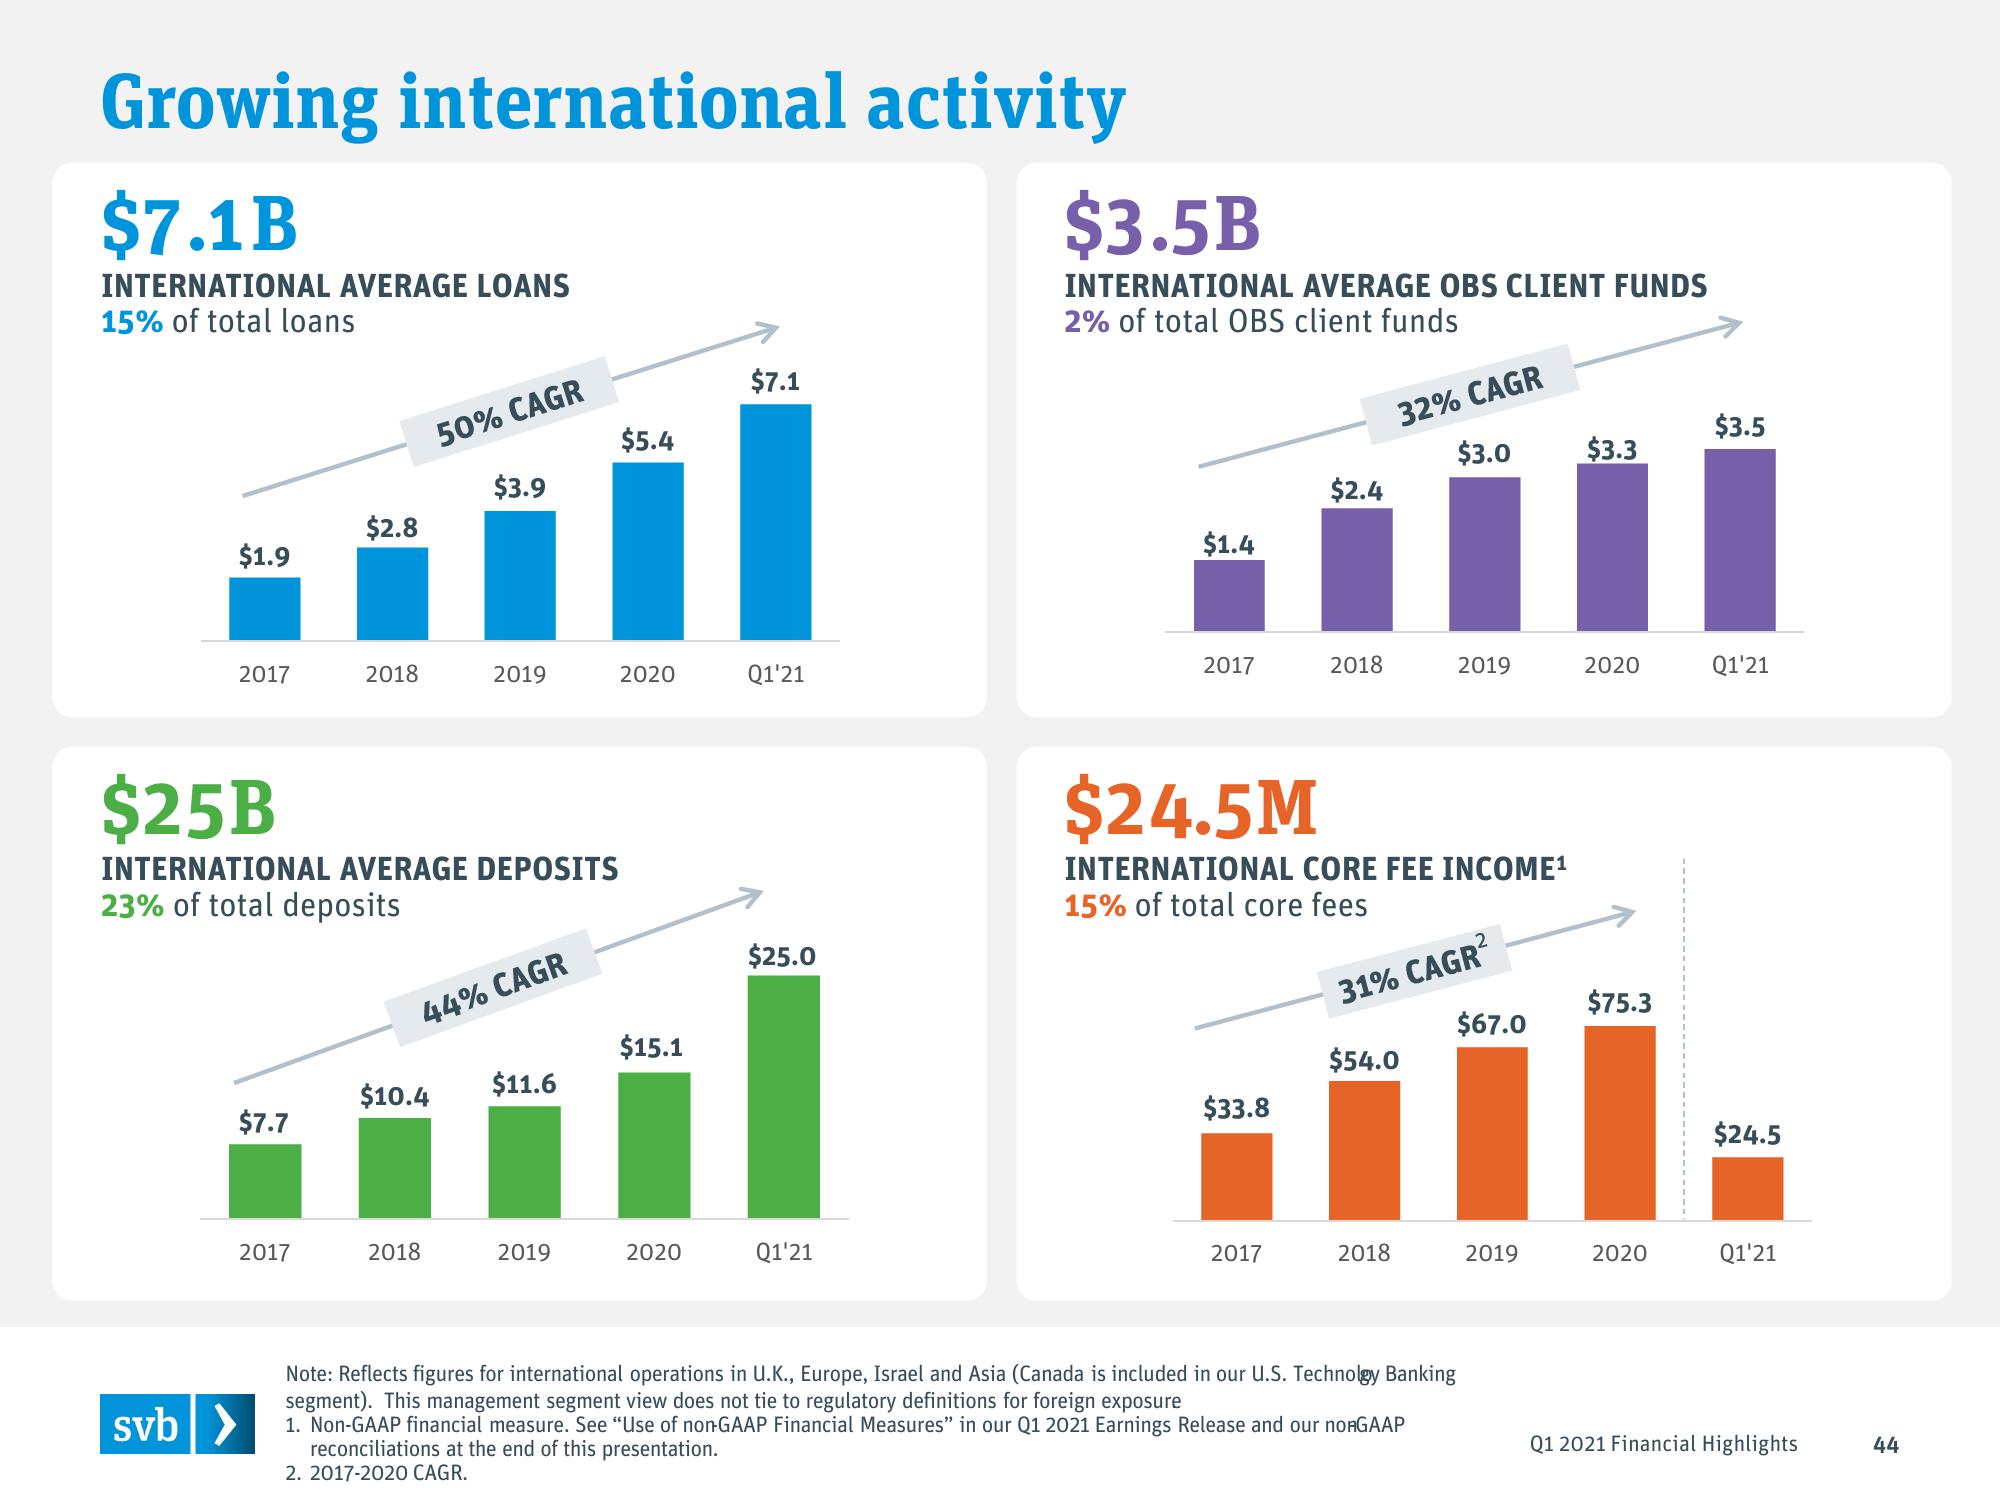
Growing international activity
$7.1B
INTERNATIONAL AVERAGE LOANS
15% of total loans
$1.9
2017
$7.7
2017
svb>
$2.8
2018
$25B
INTERNATIONAL AVERAGE DEPOSITS
23% of total deposits
50% CAGR
$10.4
$3.9
2018
2019
44% CAGR
$11.6
2019
$5.4
2020
$15.1
2020
$7.1
Q1'21
$25.0
Q1'21
$3.5B
INTERNATIONAL AVERAGE OBS CLIENT FUNDS
2% of total OBS client funds
$1.4
2017
$33.8
$2.4
2017
2018
$24.5M
INTERNATIONAL CORE FEE INCOME¹
15% of total core fees
32% CAGR
$3.0
31% CAGR²
$54.0
2018
2019
Note: Reflects figures for international operations in U.K., Europe, Israel and Asia (Canada is included in our U.S. Technolgy Banking
segment). This management segment view does not tie to regulatory definitions for foreign exposure
1. Non-GAAP financial measure. See "Use of non-GAAP Financial Measures" in our Q1 2021 Earnings Release and our no GAAP
reconciliations at the end of this presentation.
2. 2017-2020 CAGR.
$67.0
2019
$3.3
2020
$75.3
2020
$3.5
Q1'21
$24.5
Q1'21
Q1 2021 Financial Highlights
44View entire presentation