Silicon Valley Bank Results Presentation Deck
Outstanding performance and SVB Leerink expansion drove Q1'21 expenses
higher than guidance; Expect FY'21 expense % growth in the high teens
●
Q1'21 activity
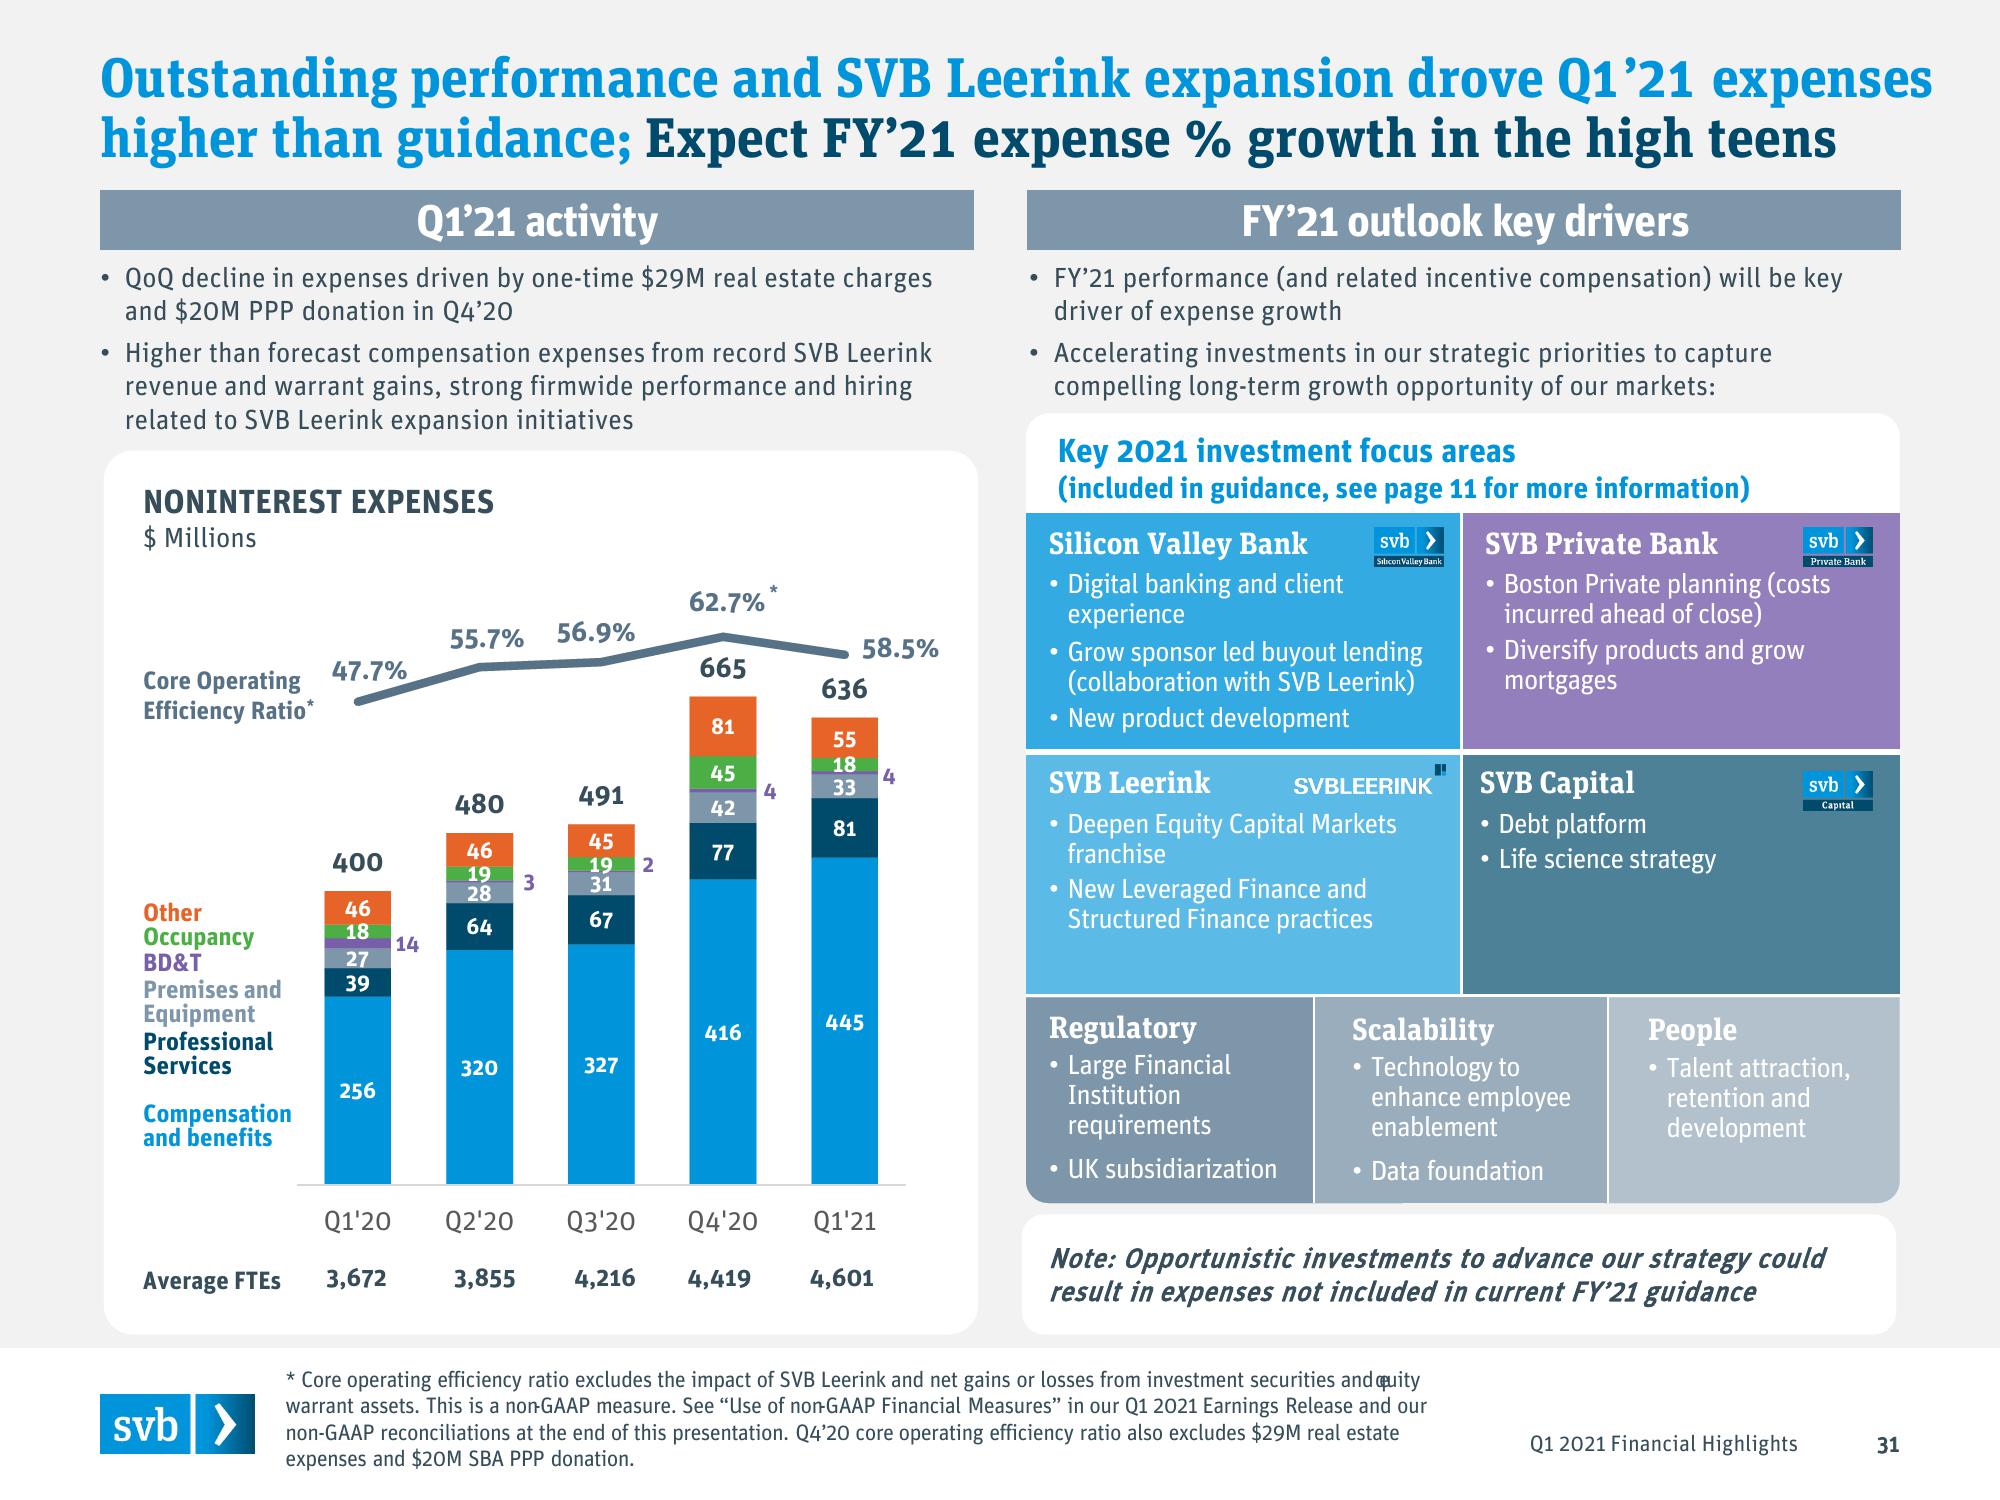
QoQ decline in expenses driven by one-time $29M real estate charges
and $20M PPP donation in Q4'20
• Higher than forecast compensation expenses from record SVB Leerink
revenue and warrant gains, strong firmwide performance and hiring
related to SVB Leerink expansion initiatives
NONINTEREST EXPENSES
$ Millions
Core Operating
Efficiency Ratio*
Other
Occupancy
BD&T
Premises and
Equipment
Professional
Services
Compensation
and benefits
Average FTES
svb >
47.7%
400
46
18
27
39
256
Q1'20
3,672
14
55.7% 56.9%
480
46
19
28
64
320
Q2'20
3,855
3
491
45
19
31
67
327
2
62.7%*
665
81
45
42
77
416
4
58.5%
636
55
18
33
81
445
Q3'20 Q4'20
Q1'21
4,216 4,419 4,601
4
FY'21 outlook key drivers
• FY'21 performance (and related incentive compensation) will be key
driver of expense growth
• Accelerating investments in our strategic priorities to capture
compelling long-term growth opportunity of our markets:
Key 2021 investment focus areas
(included in guidance, see page 11 for more information)
Silicon Valley Bank
• Digital banking and client
experience
Grow sponsor led buyout lending
(collaboration with SVB Leerink)
New product development
svb
Silicon Valley Bank
SVB Leerink
Deepen Equity Capital Markets
franchise
New Leveraged Finance and
Structured Finance practices
Regulatory
Large Financial
Institution
requirements
UK subsidiarization
SVBLEERINK
SVB Private Bank
Boston Private planning (costs
incurred ahead of close)
Diversify products and grow
mortgages
●
* Core operating efficiency ratio excludes the impact of SVB Leerink and net gains or losses from investment securities and quity
warrant assets. This is a non-GAAP measure. See "Use of non-GAAP Financial Measures" in our Q1 2021 Earnings Release and our
non-GAAP reconciliations at the end of this presentation. Q4'20 core operating efficiency ratio also excludes $29M real estate
expenses and $20M SBA PPP donation.
SVB Capital
Debt platform
Life science strategy
●
Scalability
• Technology to
enhance employee
enablement
Data foundation
svb
Private Bank
svb >
Capital
People
• Talent attraction,
retention and
development
Note: Opportunistic investments to advance our strategy could
result in expenses not included in current FY'21 guidance
Q1 2021 Financial Highlights
31View entire presentation