Silicon Valley Bank Results Presentation Deck
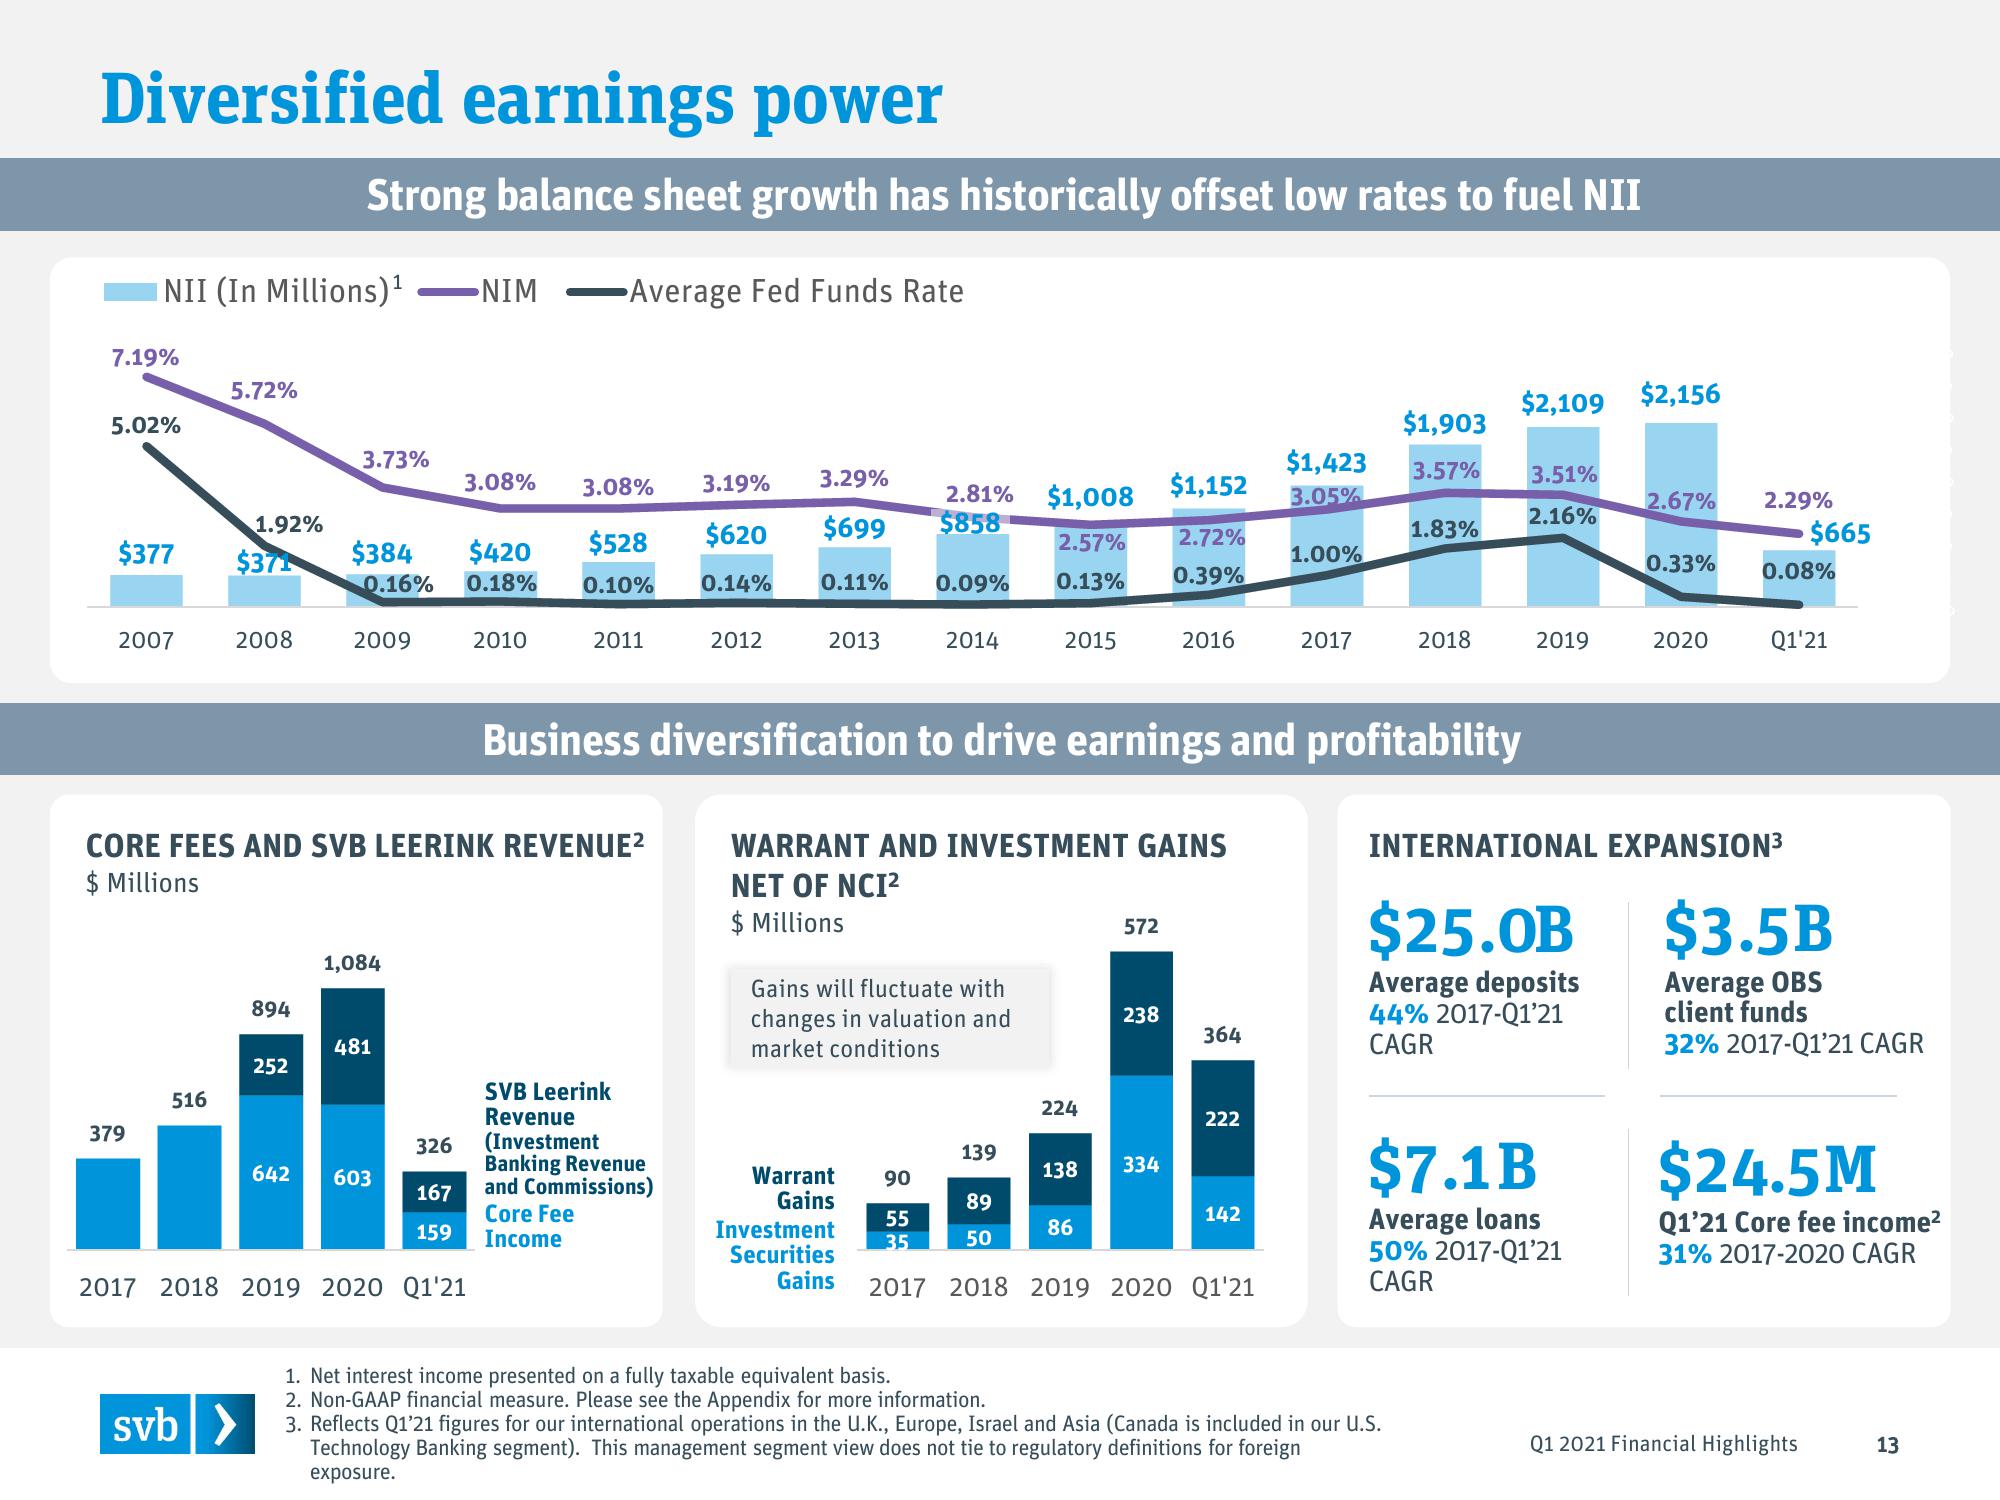
Diversified earnings power
7.19%
NII (In Millions) ¹
5.02%
$377
2007
379
5.72%
516
1.92%
$371
2008
svb >
894
Strong balance sheet growth has historically offset low rates to fuel NII
-NIM Average Fed Funds Rate
252
642
3.73%
$384
0.16%
2009
CORE FEES AND SVB LEERINK REVENUE²
$ Millions
1,084
481
603
3.08% 3.08%
$528
0.10%
326
167
159
$420
0.18%
2017 2018 2019 2020 Q1'21
2010
2011
3.19% 3.29%
$620
$699
0.14%
SVB Leerink
Revenue
(Investment
Banking Revenue
and Commissions)
Core Fee
Income
2012
0.11%
2013
2.81% $1,008
$858
Warrant
Gains
Investment
Securities
0.09%
90
55
35
2014
Gains will fluctuate with
changes in valuation and
market conditions
139
2.57%
0.13%
89
50
2015
Business diversification to drive earnings and profitability
WARRANT AND INVESTMENT GAINS
NET OF NCI²
$ Millions
224
138
86
572
238
$1,152
2.72%
0.39%
334
2016
364
222
142
$1,903
$1,423 3.57%
3.05%
Gains 2017 2018 2019 2020 Q1'21
1.00%
2017
1.83%
2018
$2,109 $2,156
1. Net interest income presented on a fully taxable equivalent basis.
2. Non-GAAP financial measure. Please see the Appendix for more information.
3. Reflects Q1'21 figures for our international operations in the U.K., Europe, Israel and Asia (Canada is included in our U.S.
Technology Banking segment). This management segment view does not tie to regulatory definitions for foreign
exposure.
3.51%
2.16%
2019
$7.1B
Average loans
50% 2017-Q1'21
CAGR
2.67% 2.29%
0.33%
2020
INTERNATIONAL EXPANSION³
$25.0B
Average deposits
44% 2017-Q1'21
CAGR
0.08%
$665
Q1'21
$3.5B
Average OBS
client funds
32% 2017-Q1'21 CAGR
$24.5M
Q1'21 Core fee income²
31% 2017-2020 CAGR
Q1 2021 Financial Highlights
13View entire presentation