Credit Suisse Investment Banking Pitch Book
CONFIDENTIAL
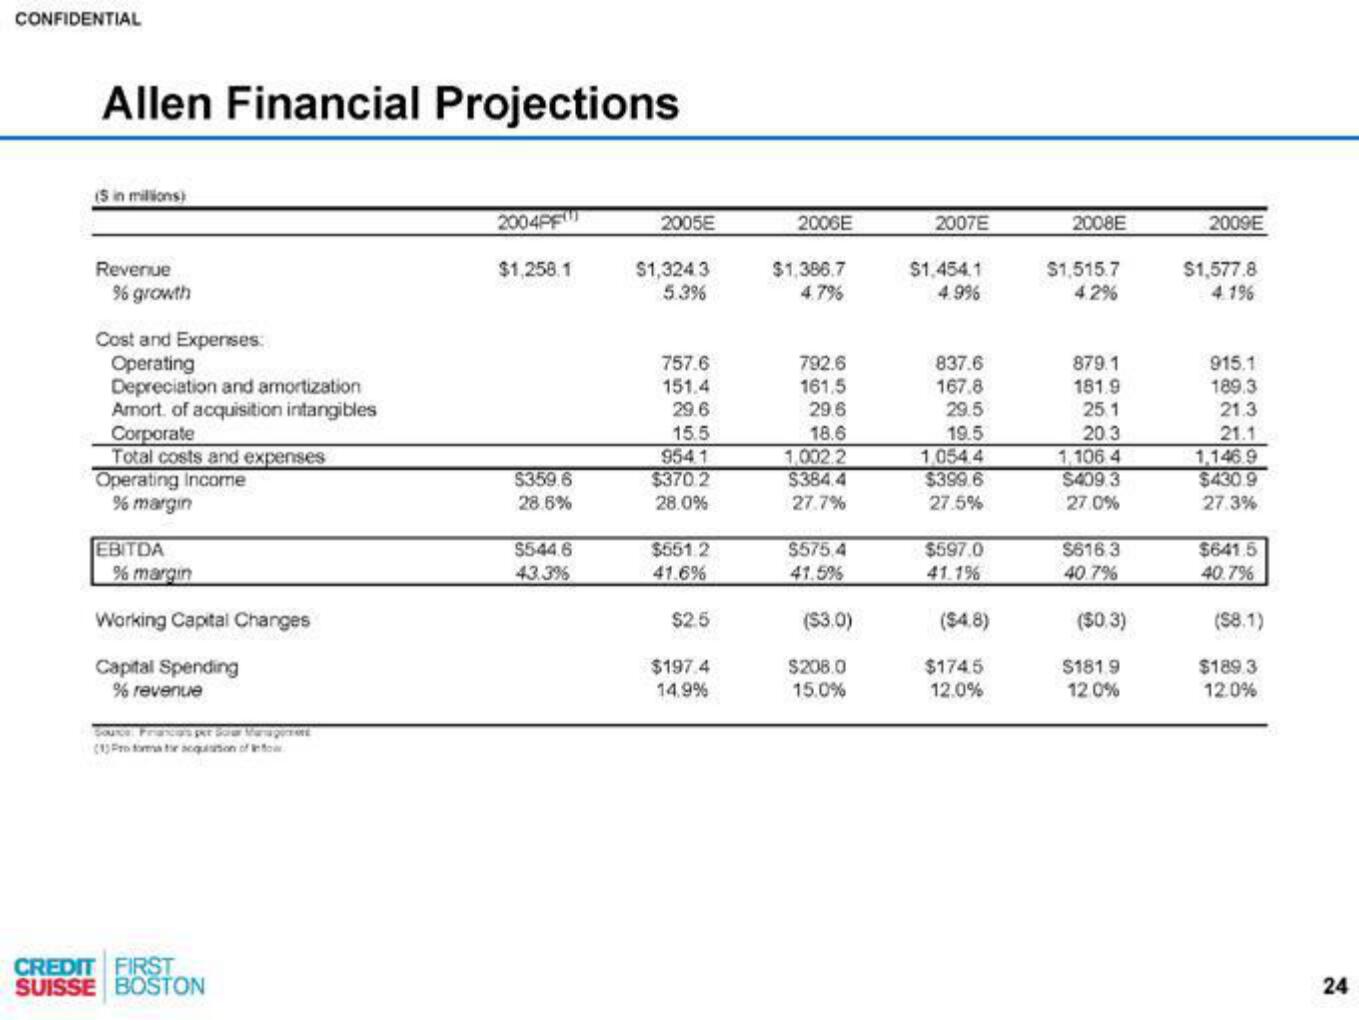
Allen Financial Projections
(5 in millions)
Revenue
%6 growth
Cost and Expenses:
Operating
Depreciation and amortization
Amort, of acquisition intangibles
Corporate
Total costs and expenses
Operating Income
% margin
EBITDA
% margin
Working Capital Changes
Capital Spending
% revenue
SOUTOR
cas per Solar Manageme
CREDIT FIRST
SUISSE BOSTON
2004PF
$1,258.1
$359.6
28.6%
$544.6
43.3%
2005E
$1,324 3
5.3%
757.6
151.4
29.6
15.5
954.1
$370.2
28.0%
$551.2
41.6%
$2.5
$197.4
14.9%
2006E
$1,386.7
4.7%
792.6
161.5
29.6
18.6
1,002.2
$384.4
27.7%
$575.4
41.5%
($3.0)
$208.0
15.0%
2007E
$1.454.1
4.9%
837.6
167.8
29.5
19.5
1,054.4
$399.6
27.5%
$597.0
41.1%
($4.8)
$174.5
12.0%
2008E
$1,515.7
4.2%
879.1
181.9
25.1
20.3
1,106 4
$409.3
27.0%
$616.3
40.7%
($0.3)
$181.9
12.0%
2009E
$1,577.8
4.196
915.1
189.3
21.3
21.1
1,146.9
$430.9
27.3%
$641.5
40.7%
($8.1)
$189.3
12.0%
24View entire presentation