Vivid Seats Results Presentation Deck slide image

Vivid Seats Results Presentation Deck

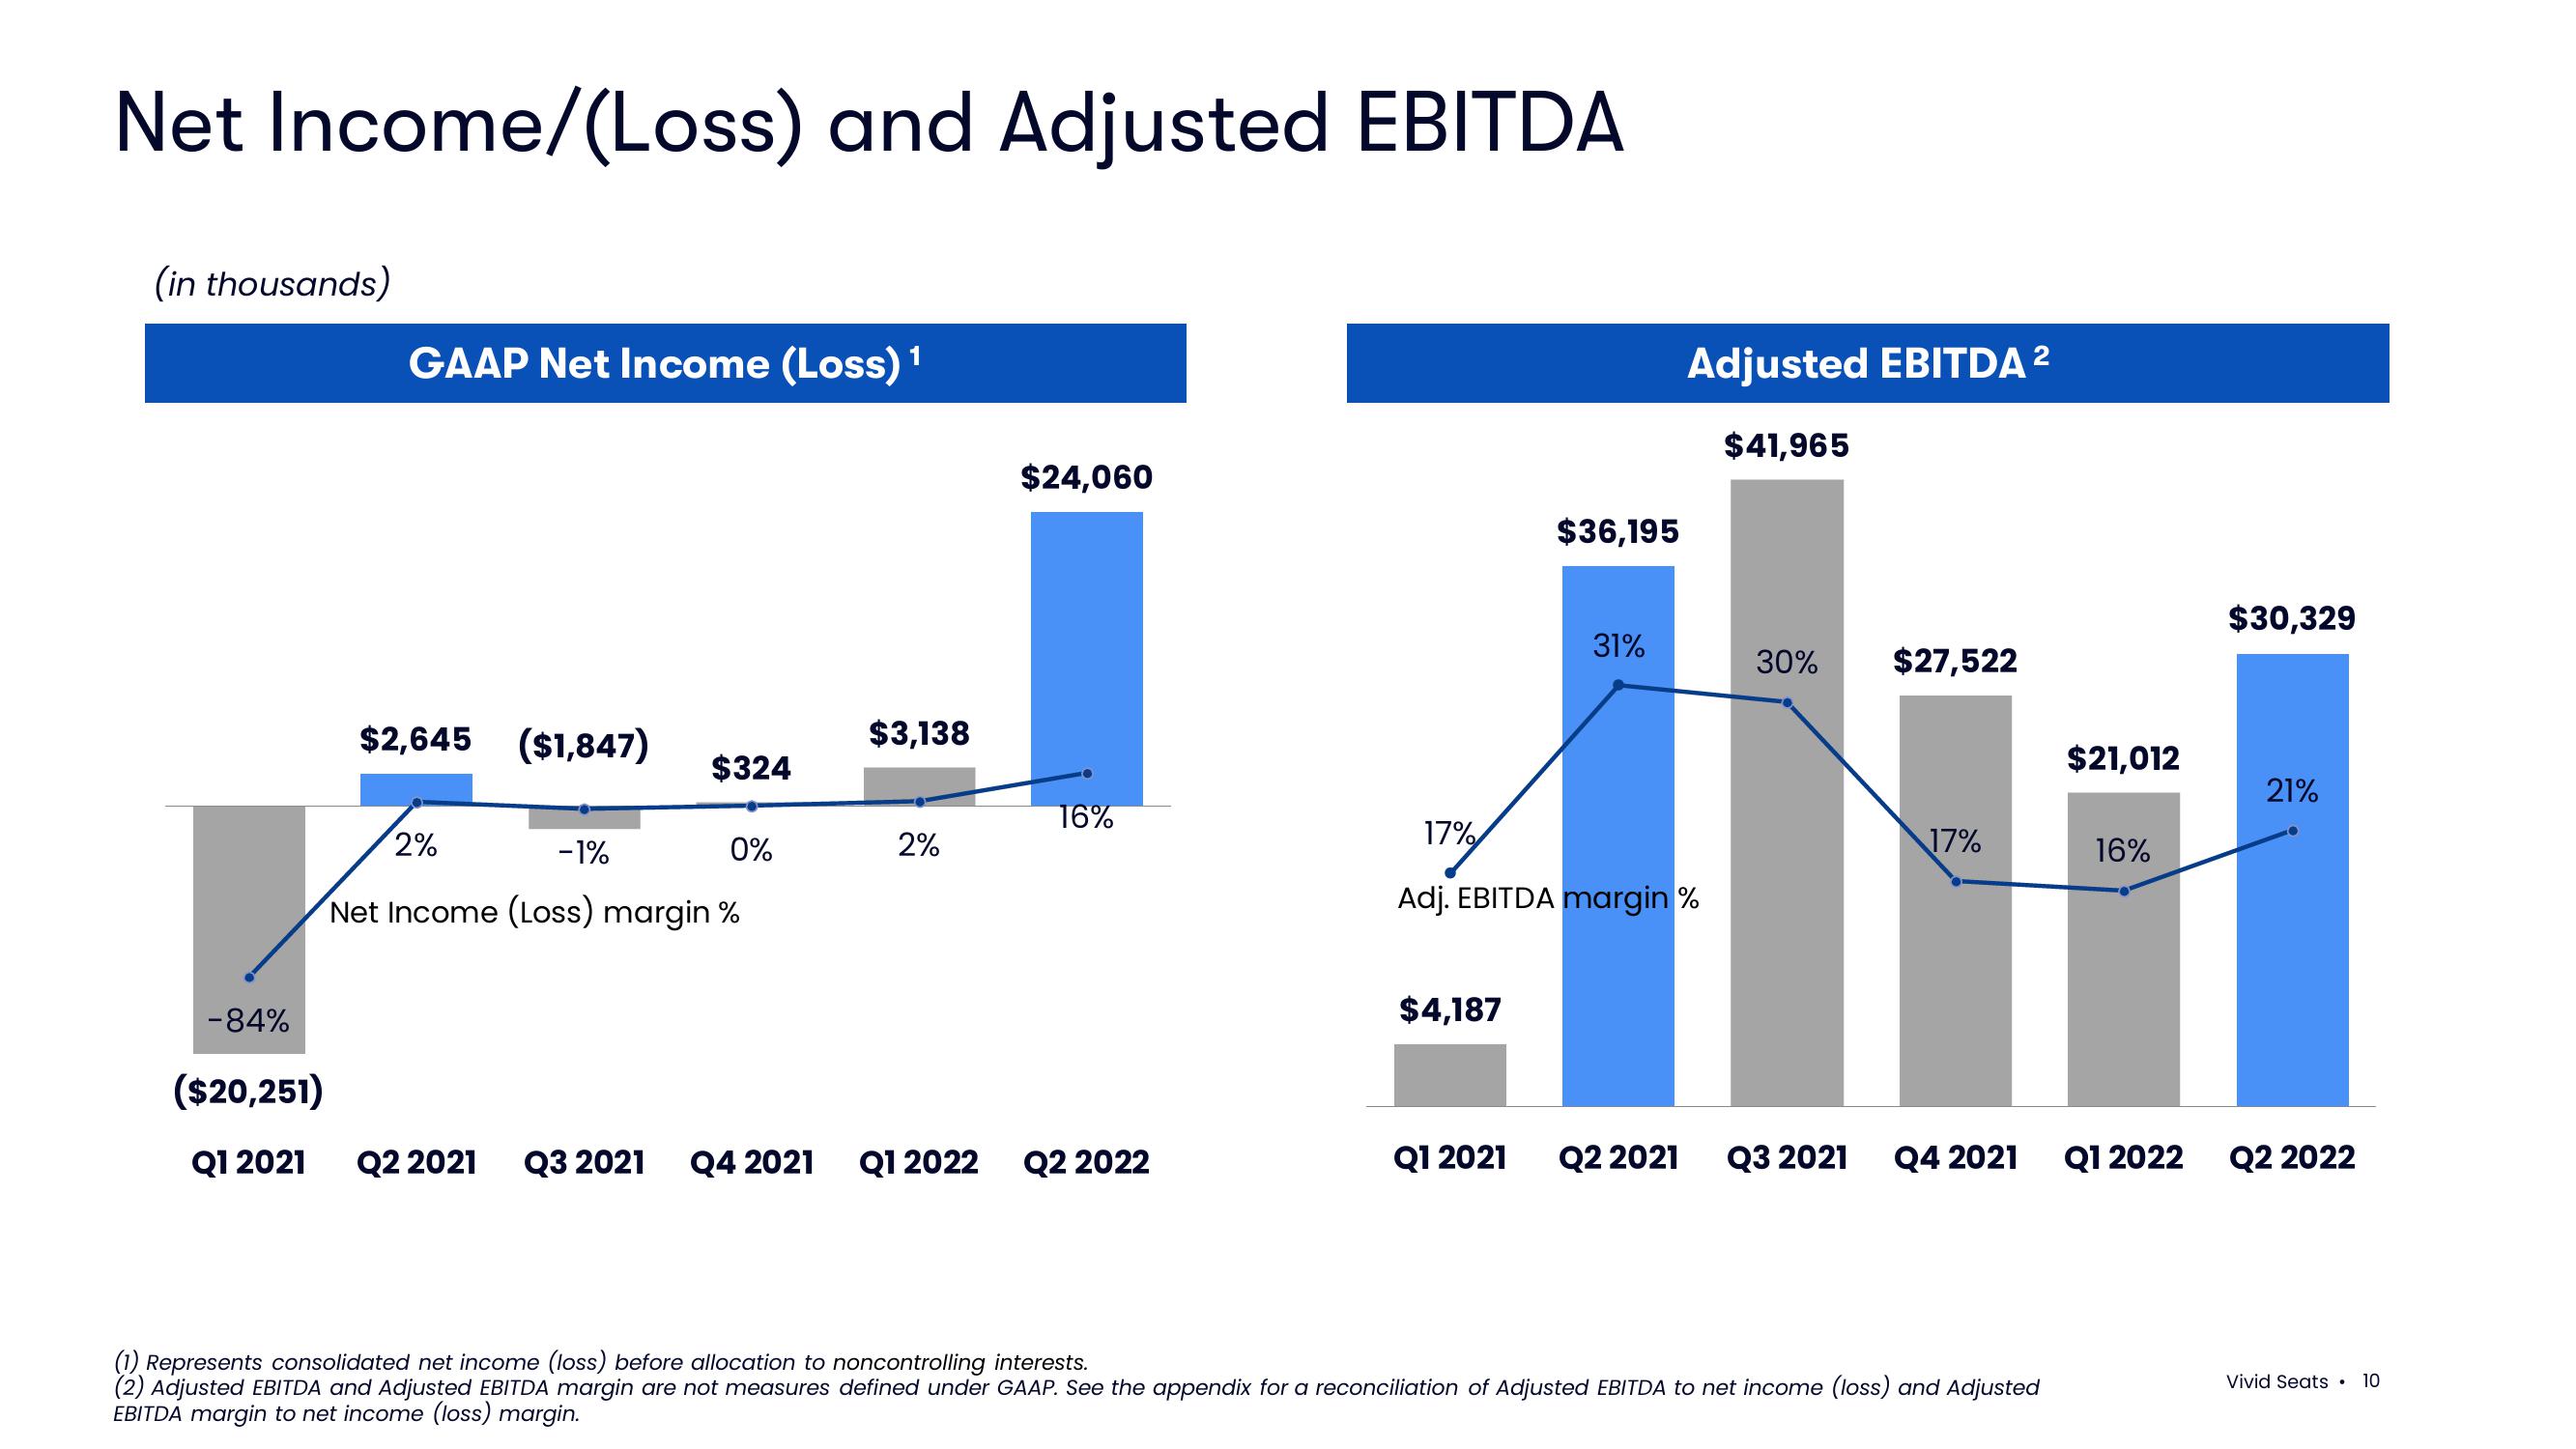
Net Income/(Loss) and Adjusted EBITDA (in thousands) -84% ($20,251) Q1 2021 1 GAAP Net Income (Loss) ¹ $2,645 ($1,847) $324 -1% 0% 2% Net Income (Loss) margin % Q2 2021 Q3 2021 Q4 2021 $3,138 $24,060 16% Q1 2022 Q2 2022 $36,195 $4,187 31% 17% Adj. EBITDA margin % Adjusted EBITDA ² $41,965 Q1 2021 Q2 2021 30% $27,522 17% Q3 2021 Q4 2021 (1) Represents consolidated net income (loss) before allocation to noncontrolling interests. (2) Adjusted EBITDA and Adjusted EBITDA margin are not measures defined under GAAP. See the appendix for a reconciliation of Adjusted EBITDA to net income (loss) and Adjusted EBITDA margin to net income (loss) margin. $21,012 16% Q1 2022 $30,329 21% Q2 2022 Vivid Seats 10
View entire presentation