OppFi SPAC Presentation Deck
36
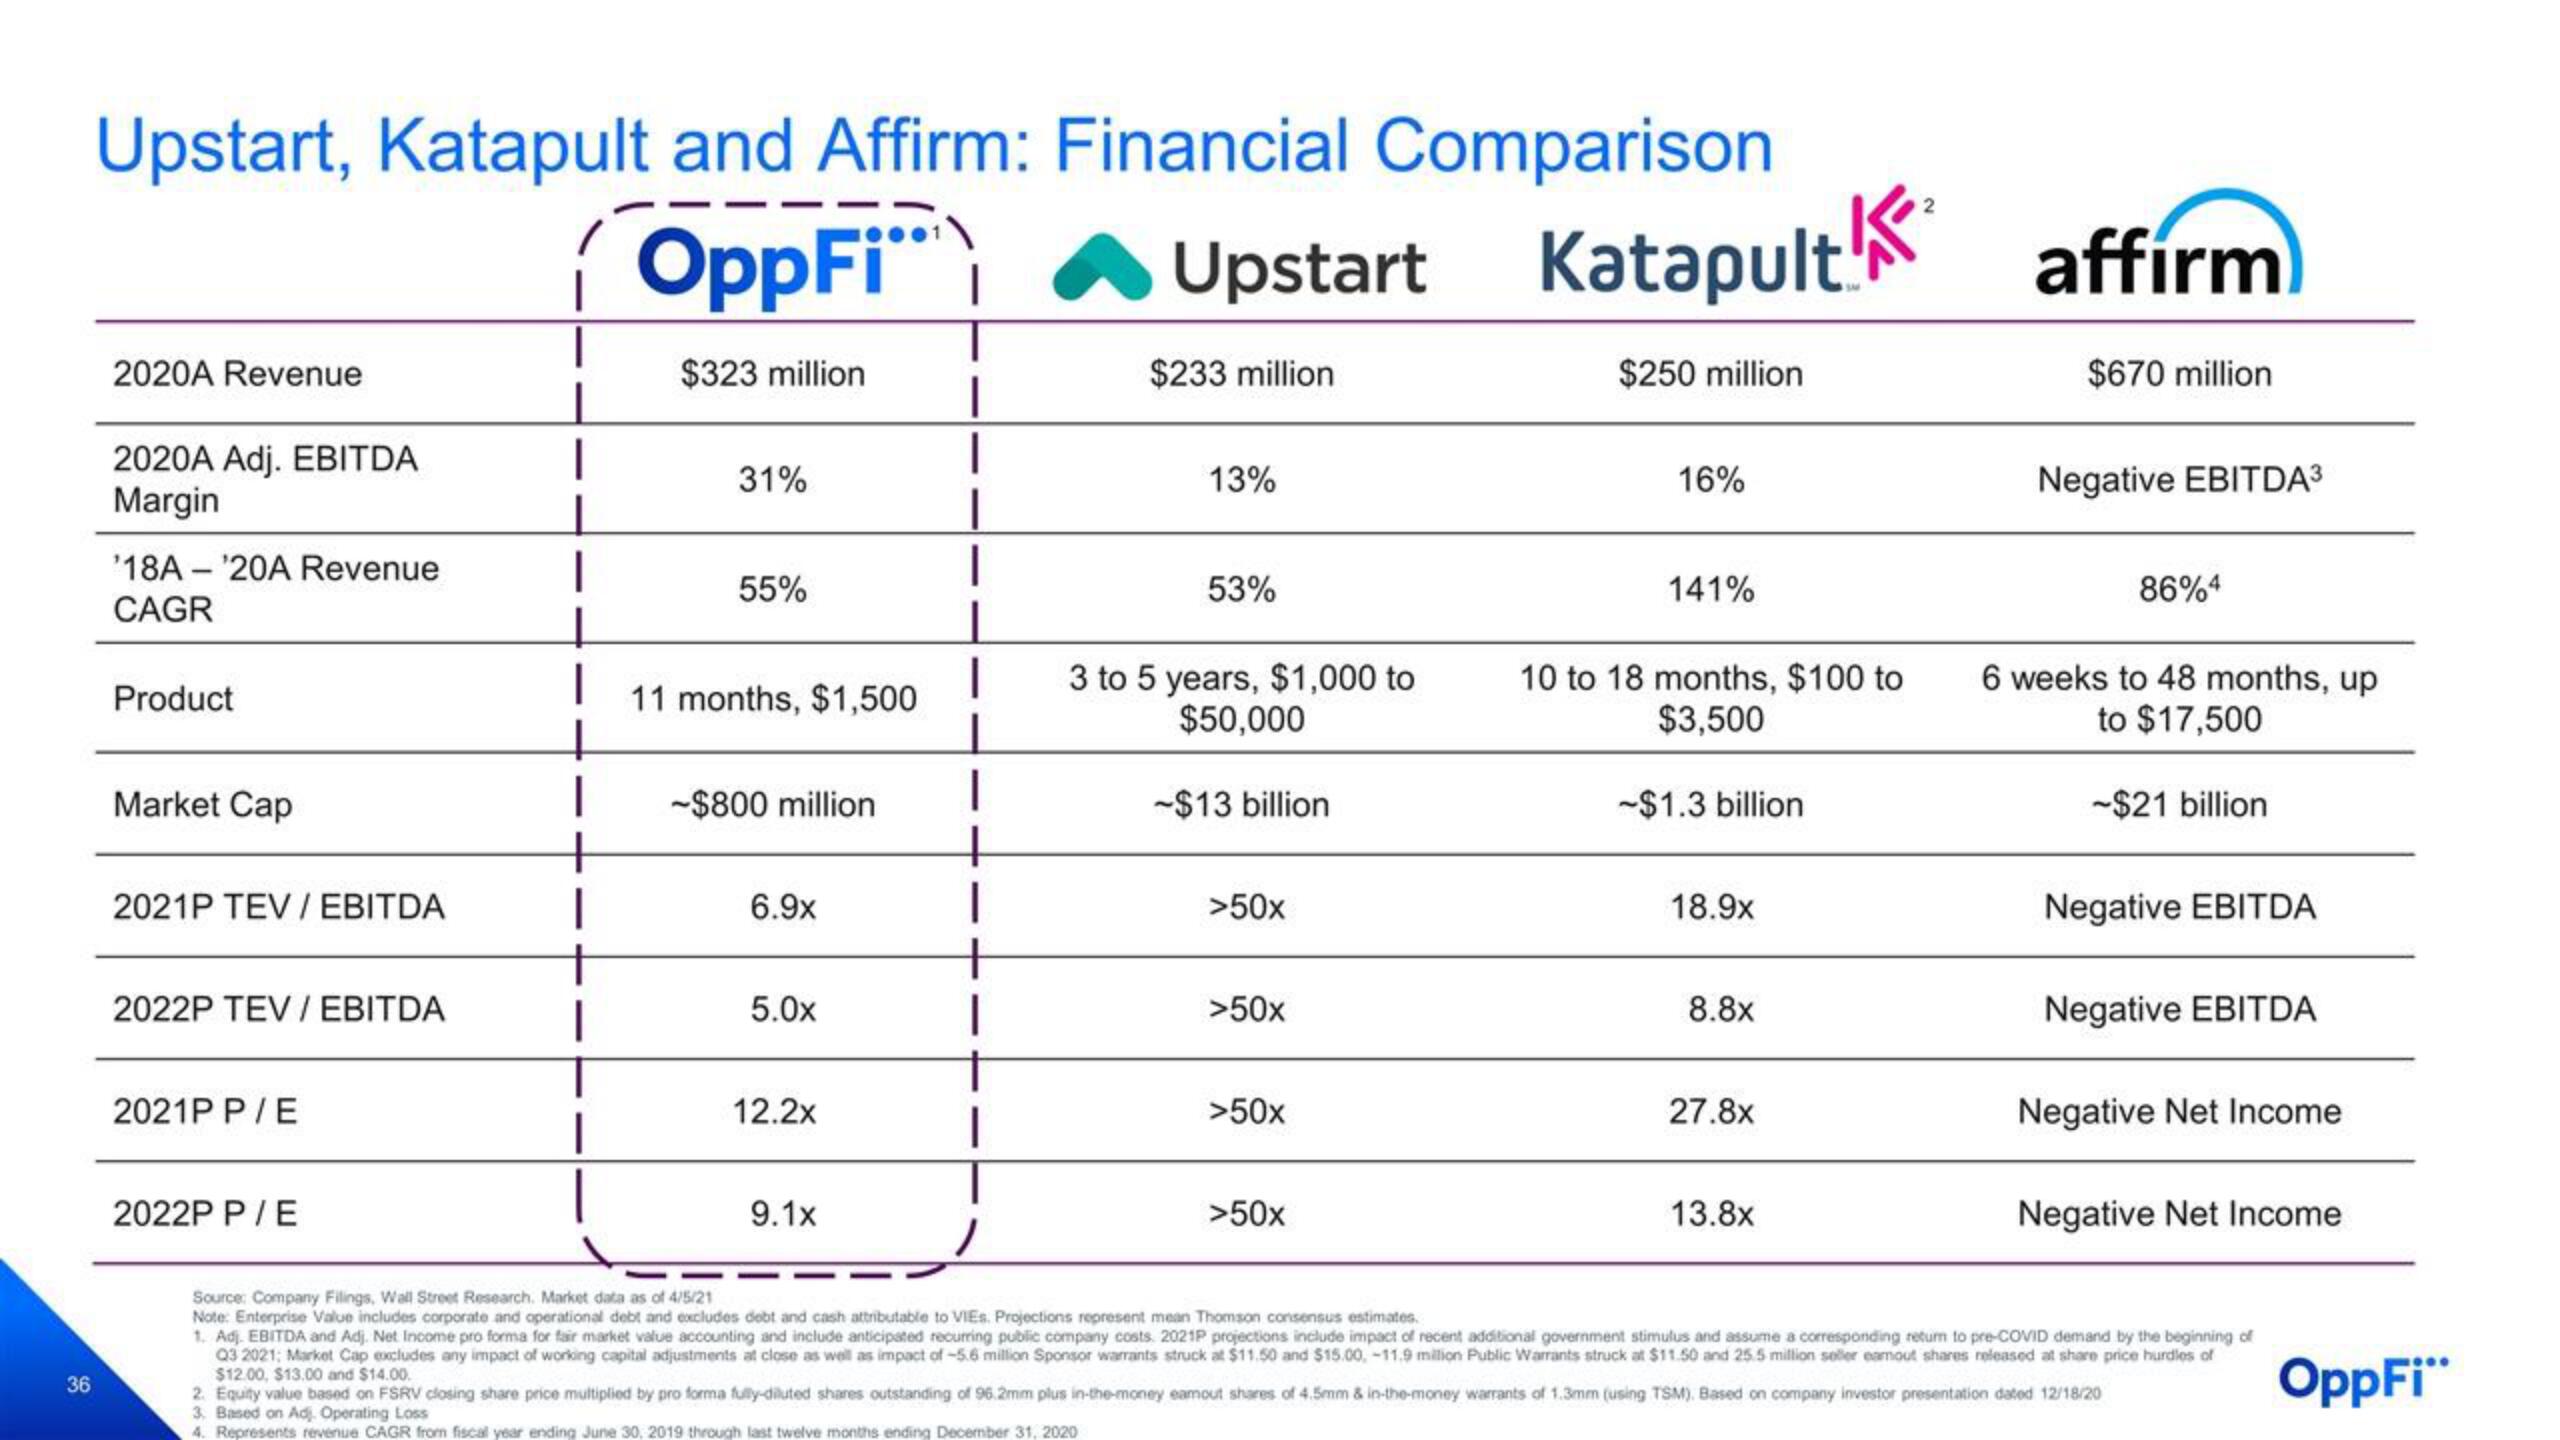
Upstart, Katapult and Affirm: Financial Comparison
OppFi
$323 million
2020A Revenue
2020A Adj. EBITDA
Margin
'18A '20A Revenue
CAGR
Product
Market Cap
2021P TEV/ EBITDA
2022P TEV/ EBITDA
2021P P/E
2022P P/E
I
|
31%
55%
11 months, $1,500
-$800 million
6.9x
5.0x
12.2x
9.1x
1
Upstart Katapult!
$233 million
13%
53%
3 to 5 years, $1,000 to
$50,000
-$13 billion
>50x
>50x
>50x
>50x
$250 million
16%
141%
10 to 18 months, $100 to
$3,500
-$1.3 billion
18.9x
8.8x
27.8x
13.8x
2
affirm
$670 million
Negative EBITDA³
86%4
6 weeks to 48 months, up
to $17,500
-$21 billion
Negative EBITDA
Negative EBITDA
Negative Net Income
Negative Net Income
Source: Company Filings, Wall Street Research. Market data as of 4/5/21
Note: Enterprise Value includes corporate and operational debt and excludes debt and cash attributable to VIEs. Projections represent mean Thomson consensus estimates.
1. Adj. EBITDA and Adj. Net Income pro forma for fair market value accounting and include anticipated recurring public company costs. 2021P projections include impact of recent additional government stimulus and assume a corresponding return to pre-COVID demand by the beginning of
Q3 2021; Market Cap excludes any impact of working capital adjustments at close as well as impact of -5.6 million Sponsor warrants struck at $11.50 and $15.00, -11.9 million Public Warrants struck at $11.50 and 25.5 million seller eamout shares released at share price hurdles of
$12.00, $13.00 and $14.00.
2. Equity value based on FSRV closing share price multiplied by pro forma fully-diluted shares outstanding of 96.2mm plus in-the-money eamout shares of 4.5mm & in-the-money warrants of 1.3mm (using TSM), Based on company investor presentation dated 12/18/20
3. Based on Adj. Operating Loss
OppFi"
4. Represents revenue CAGR from fiscal year ending June 30, 2019 through last twelve months ending December 31, 2020View entire presentation