SmileDirectClub Investor Presentation Deck
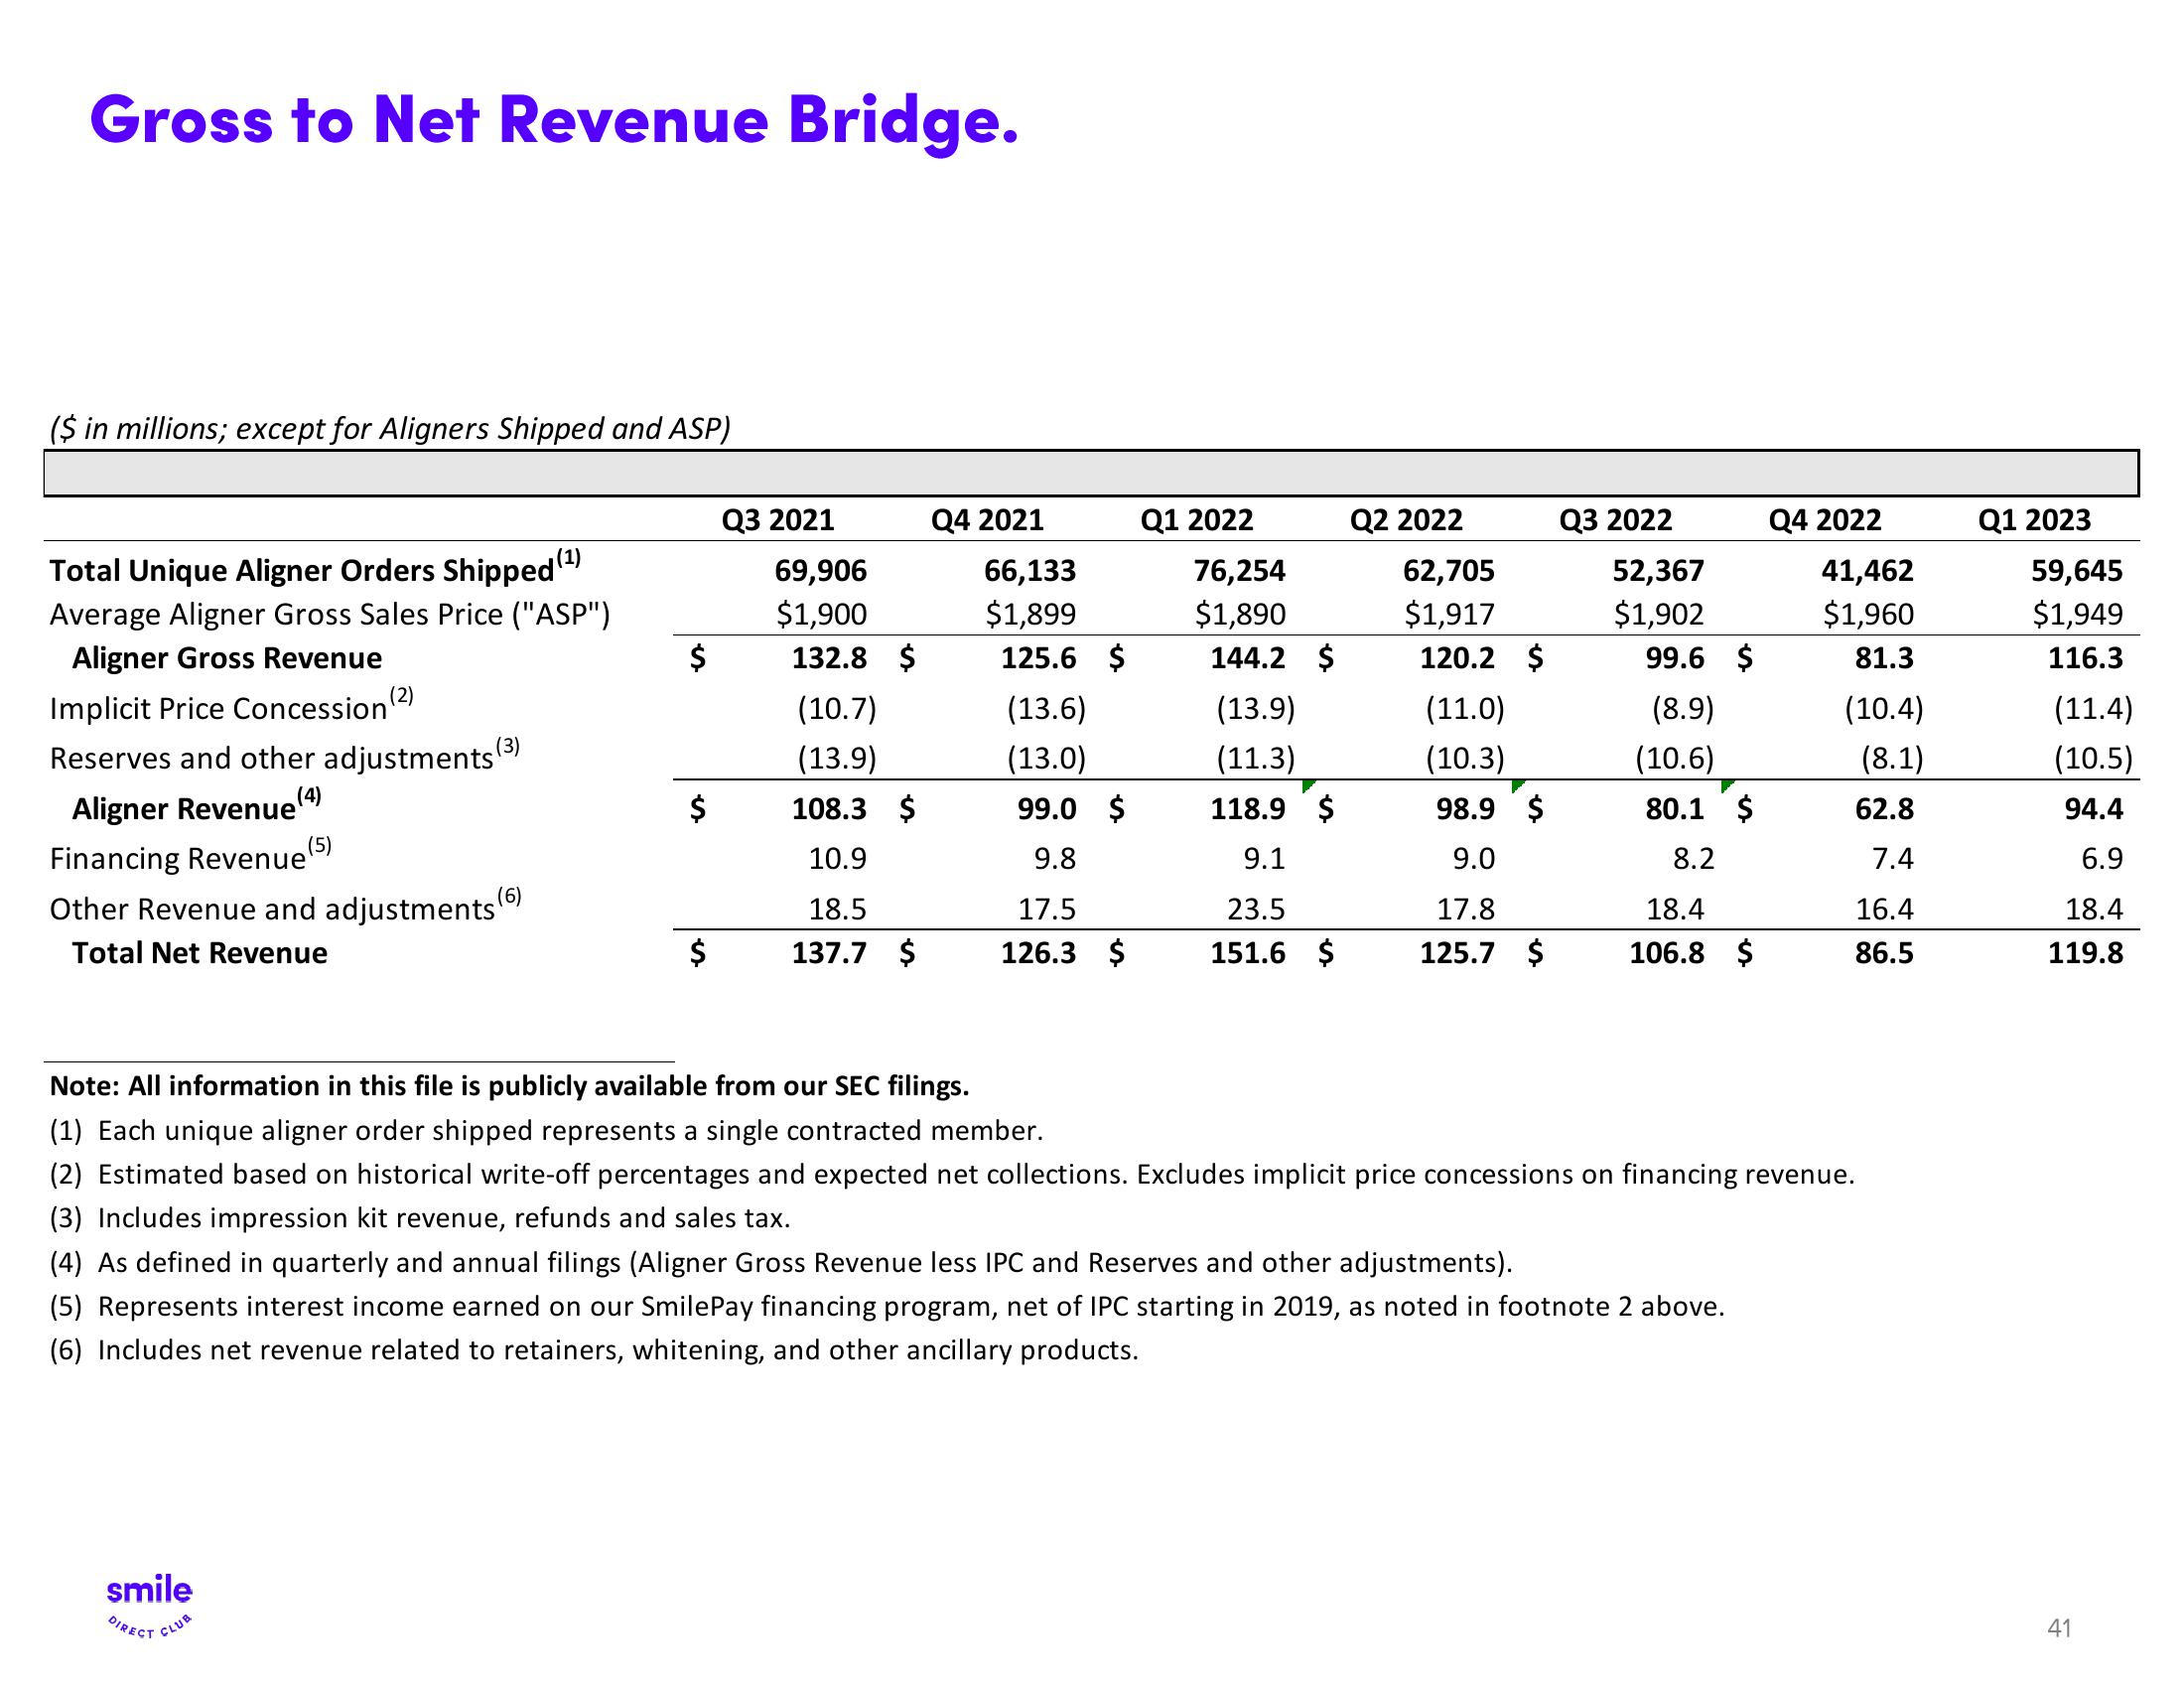
Gross to Net Revenue Bridge.
($ in millions; except for Aligners Shipped and ASP)
Total Unique Aligner Orders Shipped (¹)
Average Aligner Gross Sales Price ("ASP")
Aligner Gross Revenue
Implicit Price Concession (²)
Reserves and other adjustments (³)
Aligner Revenue (4
Financing Revenue (5)
Other Revenue and adjustments (6)
Total Net Revenue
$
smile
DIRECT CLUB
$
$
Q3 2021
69,906
$1,900
132.8 $
(10.7)
(13.9)
108.3 $
10.9
18.5
137.7 $
Q4 2021
66,133
$1,899
125.6 $
(13.6)
(13.0)
99.0 $
9.8
17.5
126.3 $
Q1 2022
76,254
$1,890
144.2 $
(13.9)
(11.3)
118.9 $
9.1
23.5
151.6 $
Q2 2022
62,705
$1,917
120.2 $
(11.0)
(10.3)
98.9 $
9.0
17.8
125.7 $
Q3 2022
52,367
$1,902
99.6 $
(8.9)
(10.6)
80.1 $
8.2
18.4
106.8 $
Q4 2022
41,462
$1,960
81.3
(10.4)
(8.1)
62.8
7.4
16.4
86.5
Note: All information in this file is publicly available from our SEC filings.
(1) Each unique aligner order shipped represents a single contracted member.
(2) Estimated based on historical write-off percentages and expected net collections. Excludes implicit price concessions on financing revenue.
(3) Includes impression kit revenue, refunds and sales tax.
(4) As defined in quarterly and annual filings (Aligner Gross Revenue less IPC and Reserves and other adjustments).
(5) Represents interest income earned on our SmilePay financing program, net of IPC starting in 2019, as noted in footnote 2 above.
(6) Includes net revenue related to retainers, whitening, and other ancillary products.
Q1 2023
59,645
$1,949
116.3
(11.4)
(10.5)
94.4
6.9
18.4
119.8
41View entire presentation