Deutsche Bank Fixed Income Presentation Deck
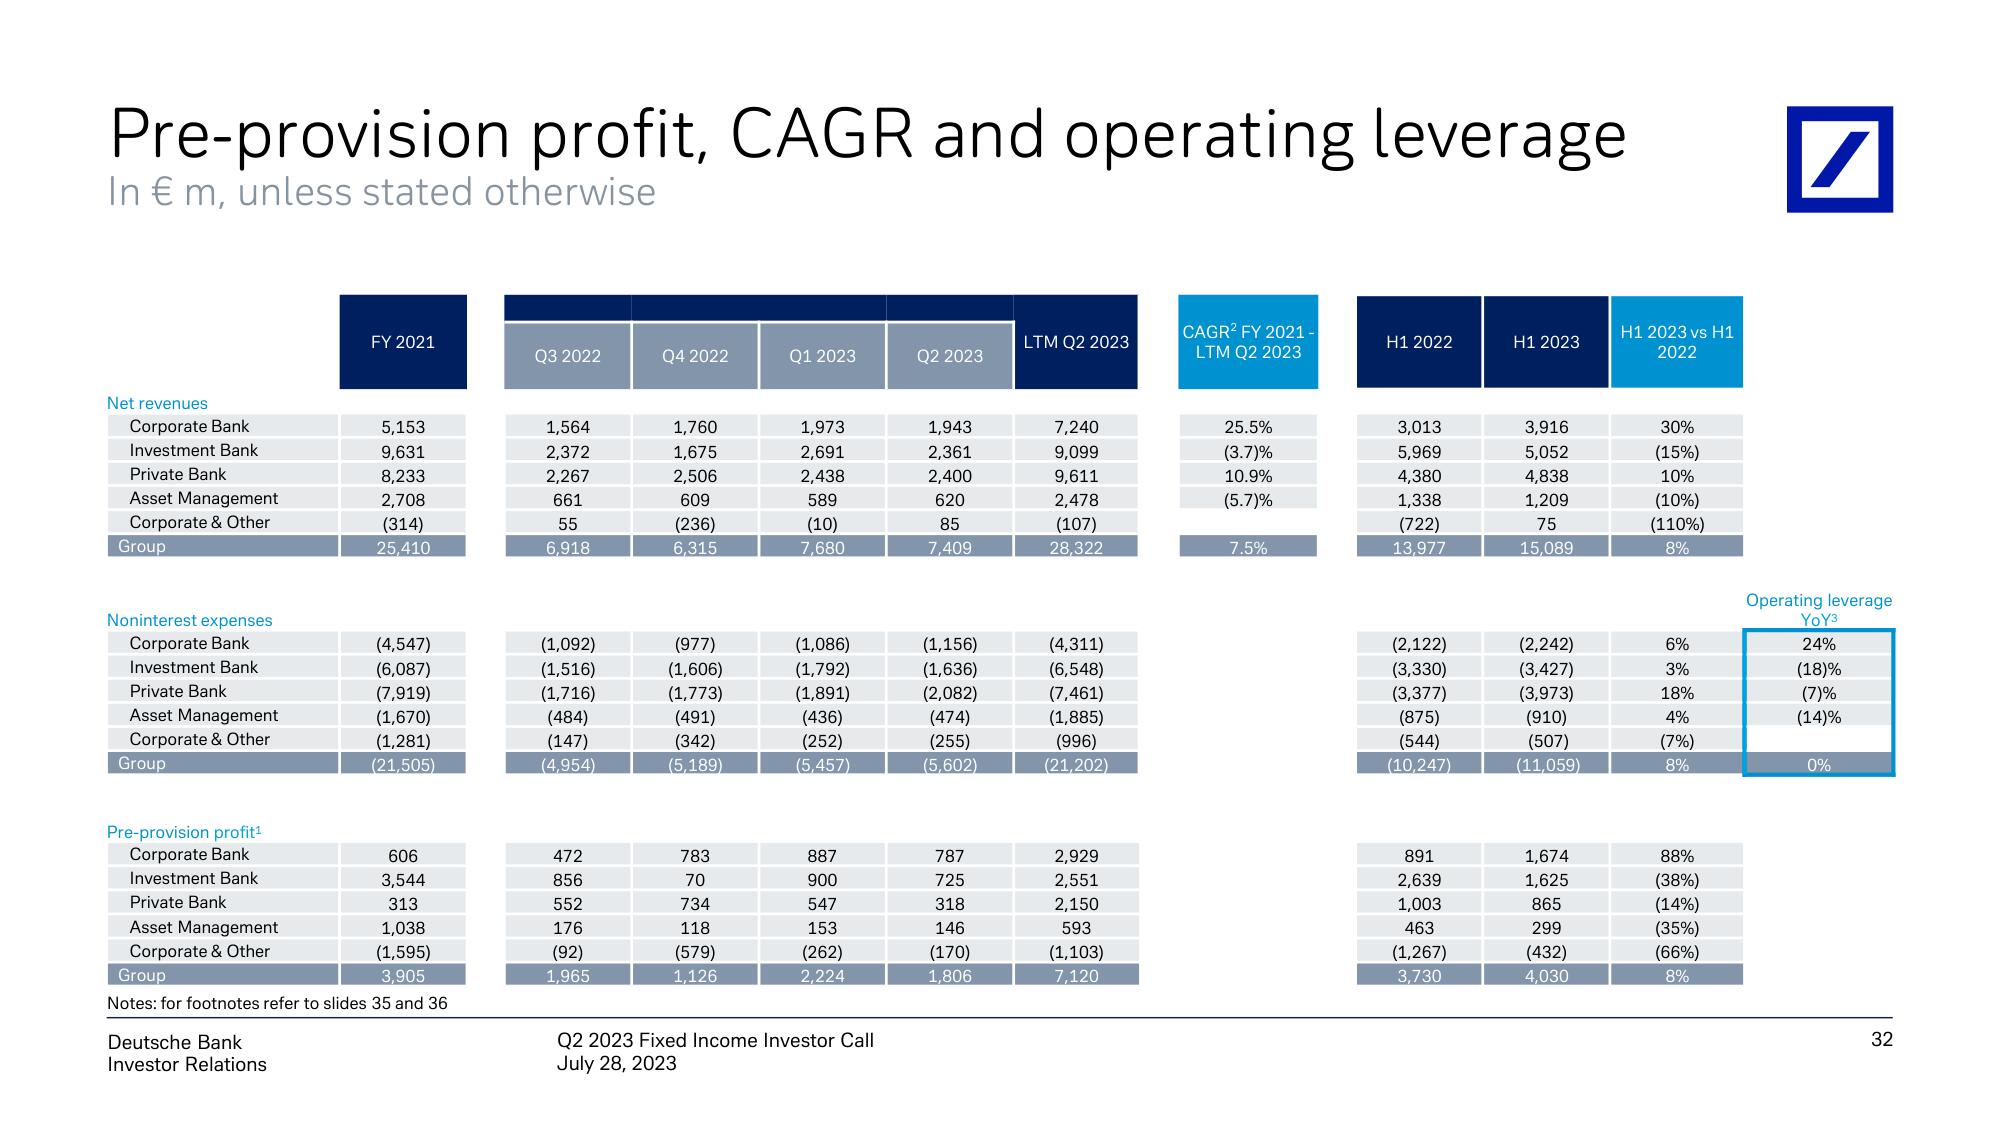
Pre-provision profit, CAGR and operating leverage
In € m, unless stated otherwise
Net revenues
Corporate Bank
Investment Bank
Private Bank
Asset Management
Corporate & Other
Group
Noninterest expenses
Corporate Bank
Investment Bank
Private Bank
Asset Management
Corporate & Other
Group
Pre-provision profit¹
Corporate Bank
Investment Bank
Private Bank
Asset Management
Corporate & Other
FY 2021
Deutsche Bank
Investor Relations
5,153
9,631
8,233
2,708
(314)
25,410
606
3,544
313
1,038
(1,595)
Group
3,905
Notes: for footnotes refer to slides 35 and 36
(4,547)
(6,087)
(7,919)
(1,670)
(1,281)
(21,505)
Q3 2022
1,564
2,372
2,267
661
55
6,918
(1,092)
(1,516)
(1,716)
(484)
(147)
(4,954)
472
856
552
176
(92)
1,965
Q4 2022
1,760
1,675
2,506
609
(236)
6,315
(977)
(1,606)
(1,773)
(491)
(342)
(5,189)
783
70
734
118
(579)
1,126
Q1 2023
1,973
2,691
2,438
589
(10)
7,680
(1,086)
(1,792)
(1,891)
(436)
(252)
(5,457)
887
900
547
153
(262)
2,224
Q2 2023 Fixed Income Investor Call
July 28, 2023
Q2 2023
1,943
2,361
2,400
620
85
7,409
(1,156)
(1,636)
(2,082)
(474)
(255)
(5,602)
787
725
318
146
(170)
1,806
LTM Q2 2023
7,240
9,099
9,611
2,478
(107)
28,322
(4,311)
(6,548)
(7,461)
(1,885)
(996)
(21,202)
2,929
2,551
2,150
593
(1,103)
7,120
CAGR2 FY 2021-
LTM Q2 2023
25.5%
(3.7)%
10.9%
(5.7)%
7.5%
H1 2022
3,013
5,969
4,380
1,338
(722)
13,977
(2,122)
(3,330)
(3,377)
(875)
(544)
(10,247)
891
2,639
1,003
463
(1,267)
3,730
H1 2023
3,916
5,052
4,838
1,209
75
15,089
(2,242)
(3,427)
(3,973)
(910)
(507)
(11,059)
1,674
1,625
865
299
(432)
4,030
H1 2023 H1
2022
30%
(15%)
10%
(10%)
(110%)
8%
6%
3%
18%
4%
(7%)
8%
88%
(38%)
(14%)
(35%)
(66%)
8%
/
Operating leverage
YoY³
24%
(18)%
(7)%
(14)%
0%
32View entire presentation