Confluent IPO Presentation Deck
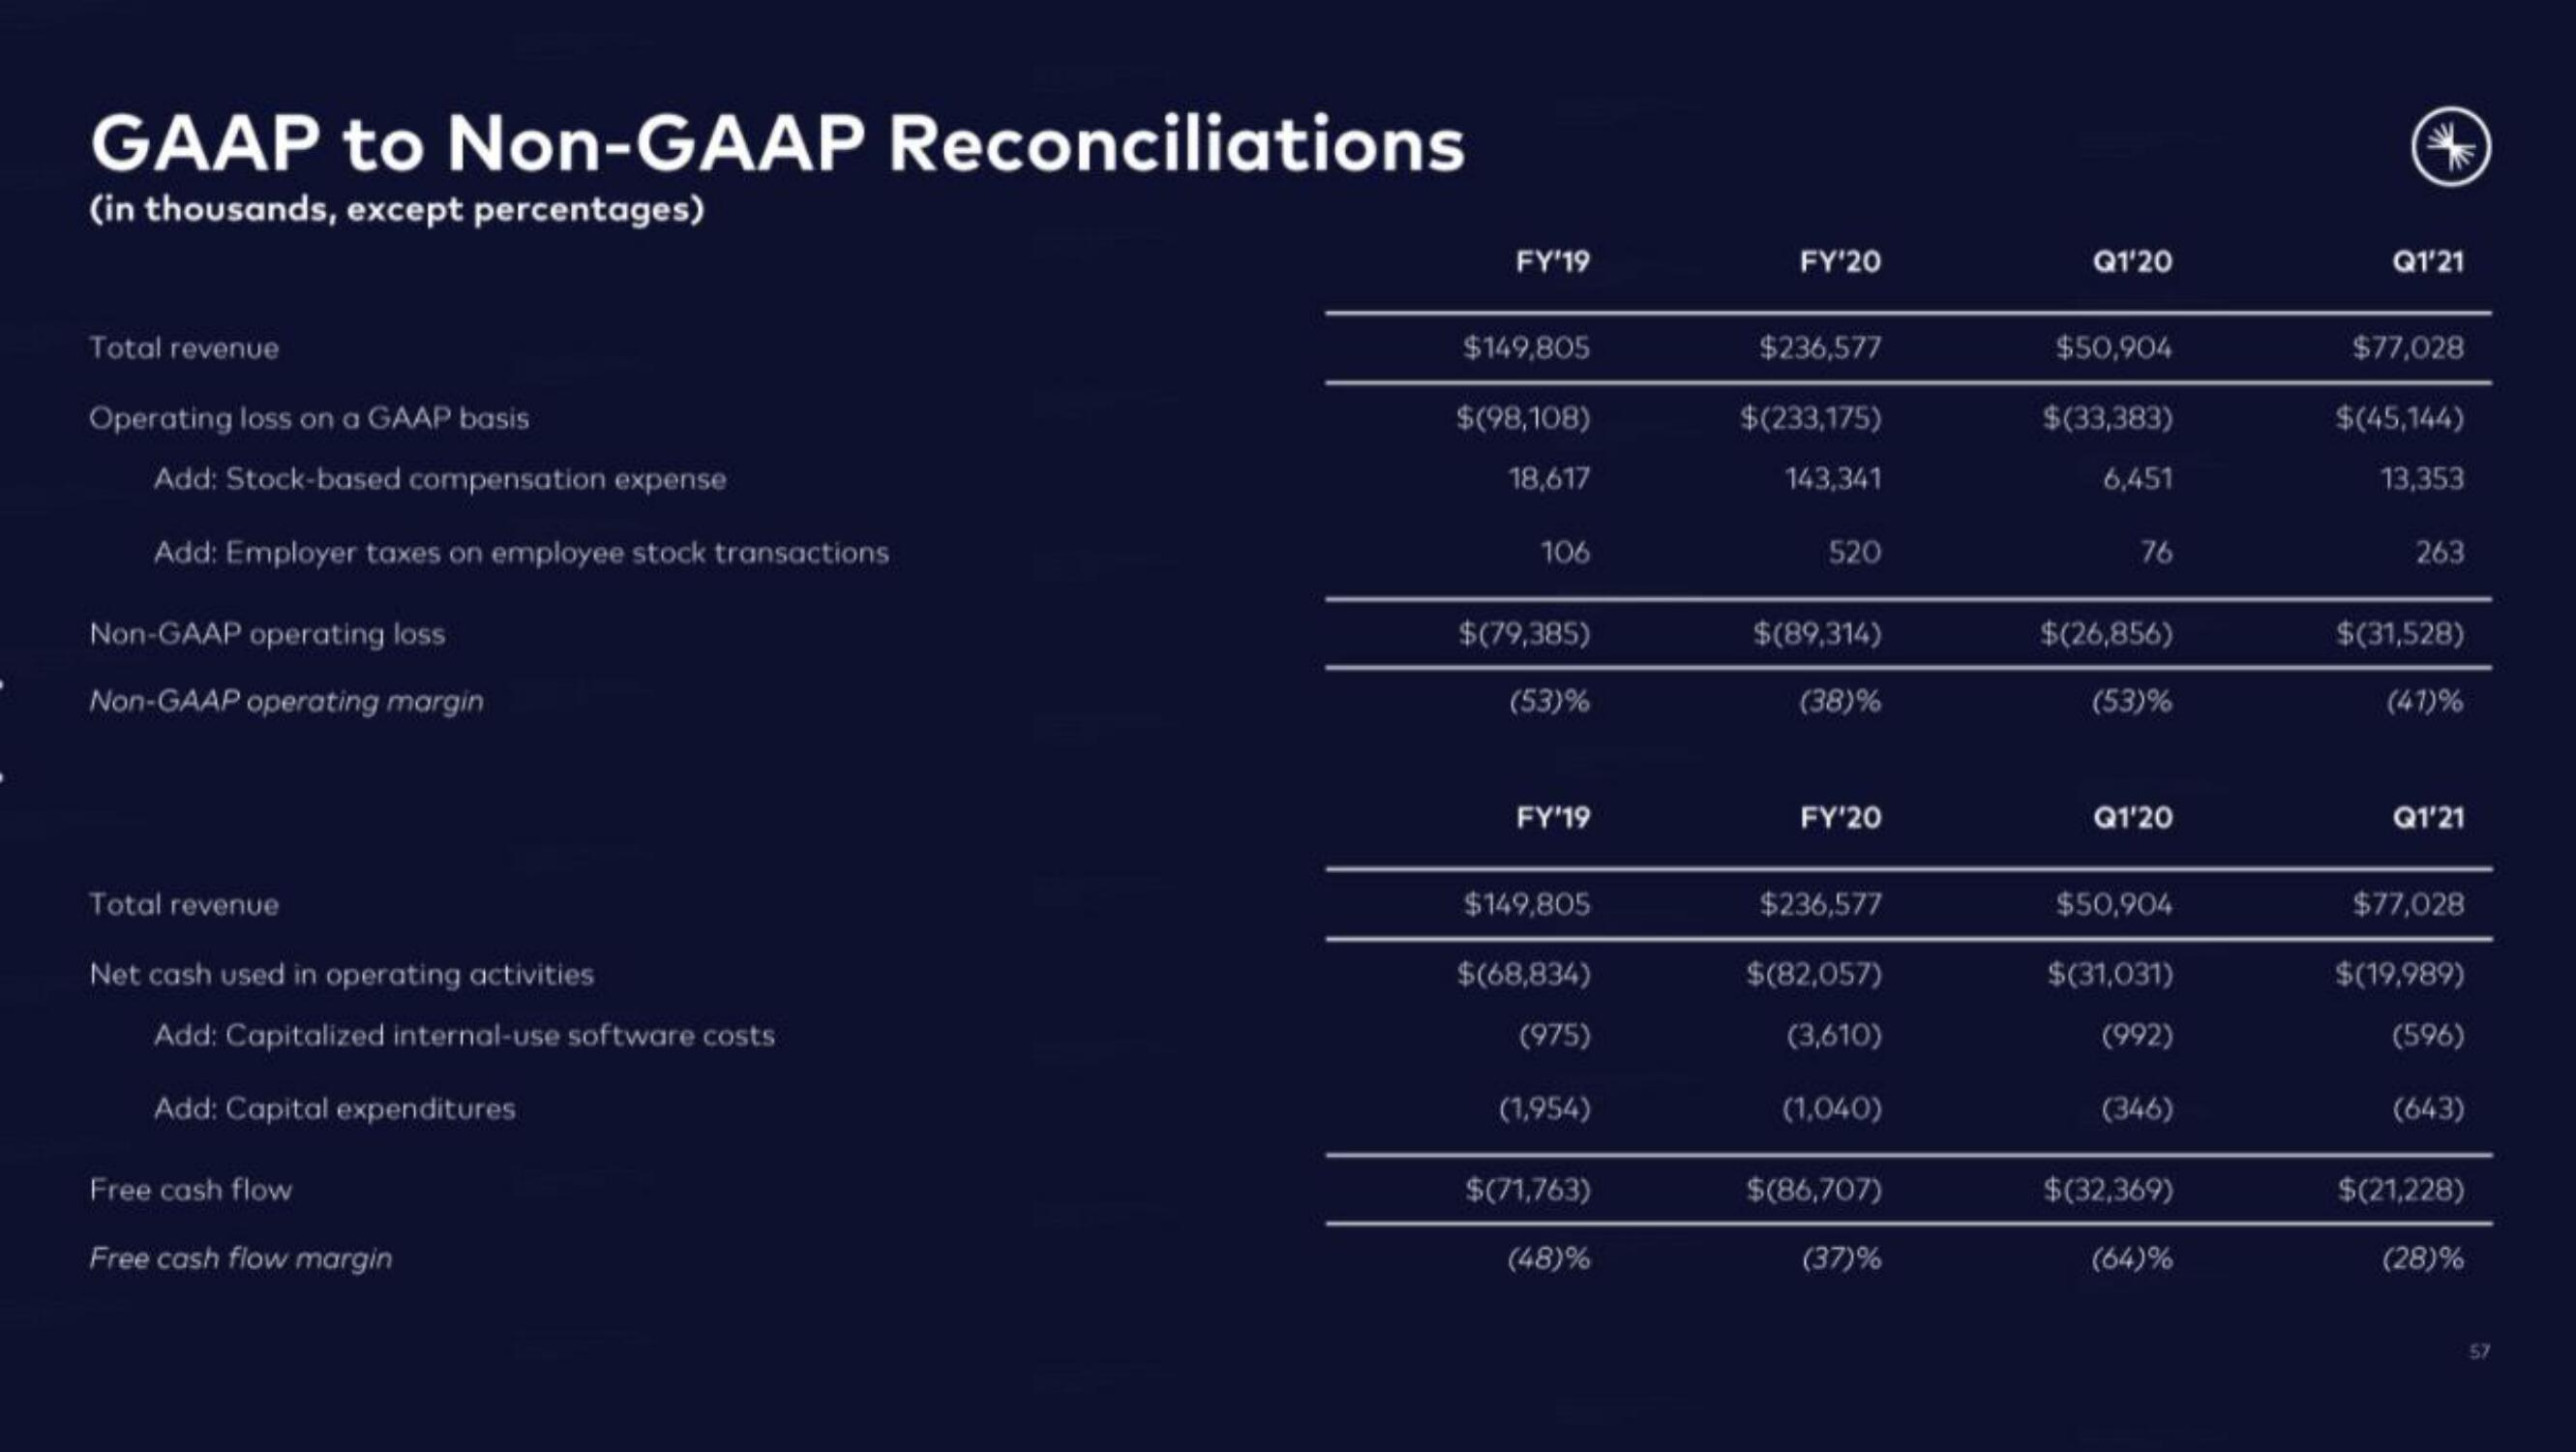
GAAP to Non-GAAP Reconciliations
(in thousands, except percentages)
Total revenue
Operating loss on a GAAP basis
Add: Stock-based compensation expense
Add: Employer taxes on employee stock transactions
Non-GAAP operating loss
Non-GAAP operating margin
Total revenue
Net cash used in operating activities
Add: Capitalized internal-use software costs
Add: Capital expenditures
Free cash flow
Free cash flow margin
FY'19
$149,805
$(98,108)
18,617
106
$(79,385)
(53)%
FY'19
$149,805
$(68,834)
(975)
(1,954)
$(71,763)
(48)%
FY'20
$236,577
$(233,175)
143,341
520
$(89,314)
(38)%
FY'20
$236,577
$(82,057)
(3,610)
(1,040)
$(86,707)
(37)%
Q1'20
$50,904
$(33,383)
6,451
76
$(26,856)
(53)%
Q1'20
$50,904
$(31,031)
(992)
(346)
$(32,369)
(64)%
Q1'21
$77,028
$(45,144)
13,353
263
$(31,528)
(47)%
Q1'21
$77,028
$(19,989)
(596)
(643)
$(21,228)
(28)%
57View entire presentation