Morgan Stanley Investment Banking Pitch Book
Portions of this exhibit marked [*] are requested to be treated confidentially
Project Roosevelt
Morgan Stanley
MONROE VALUATION
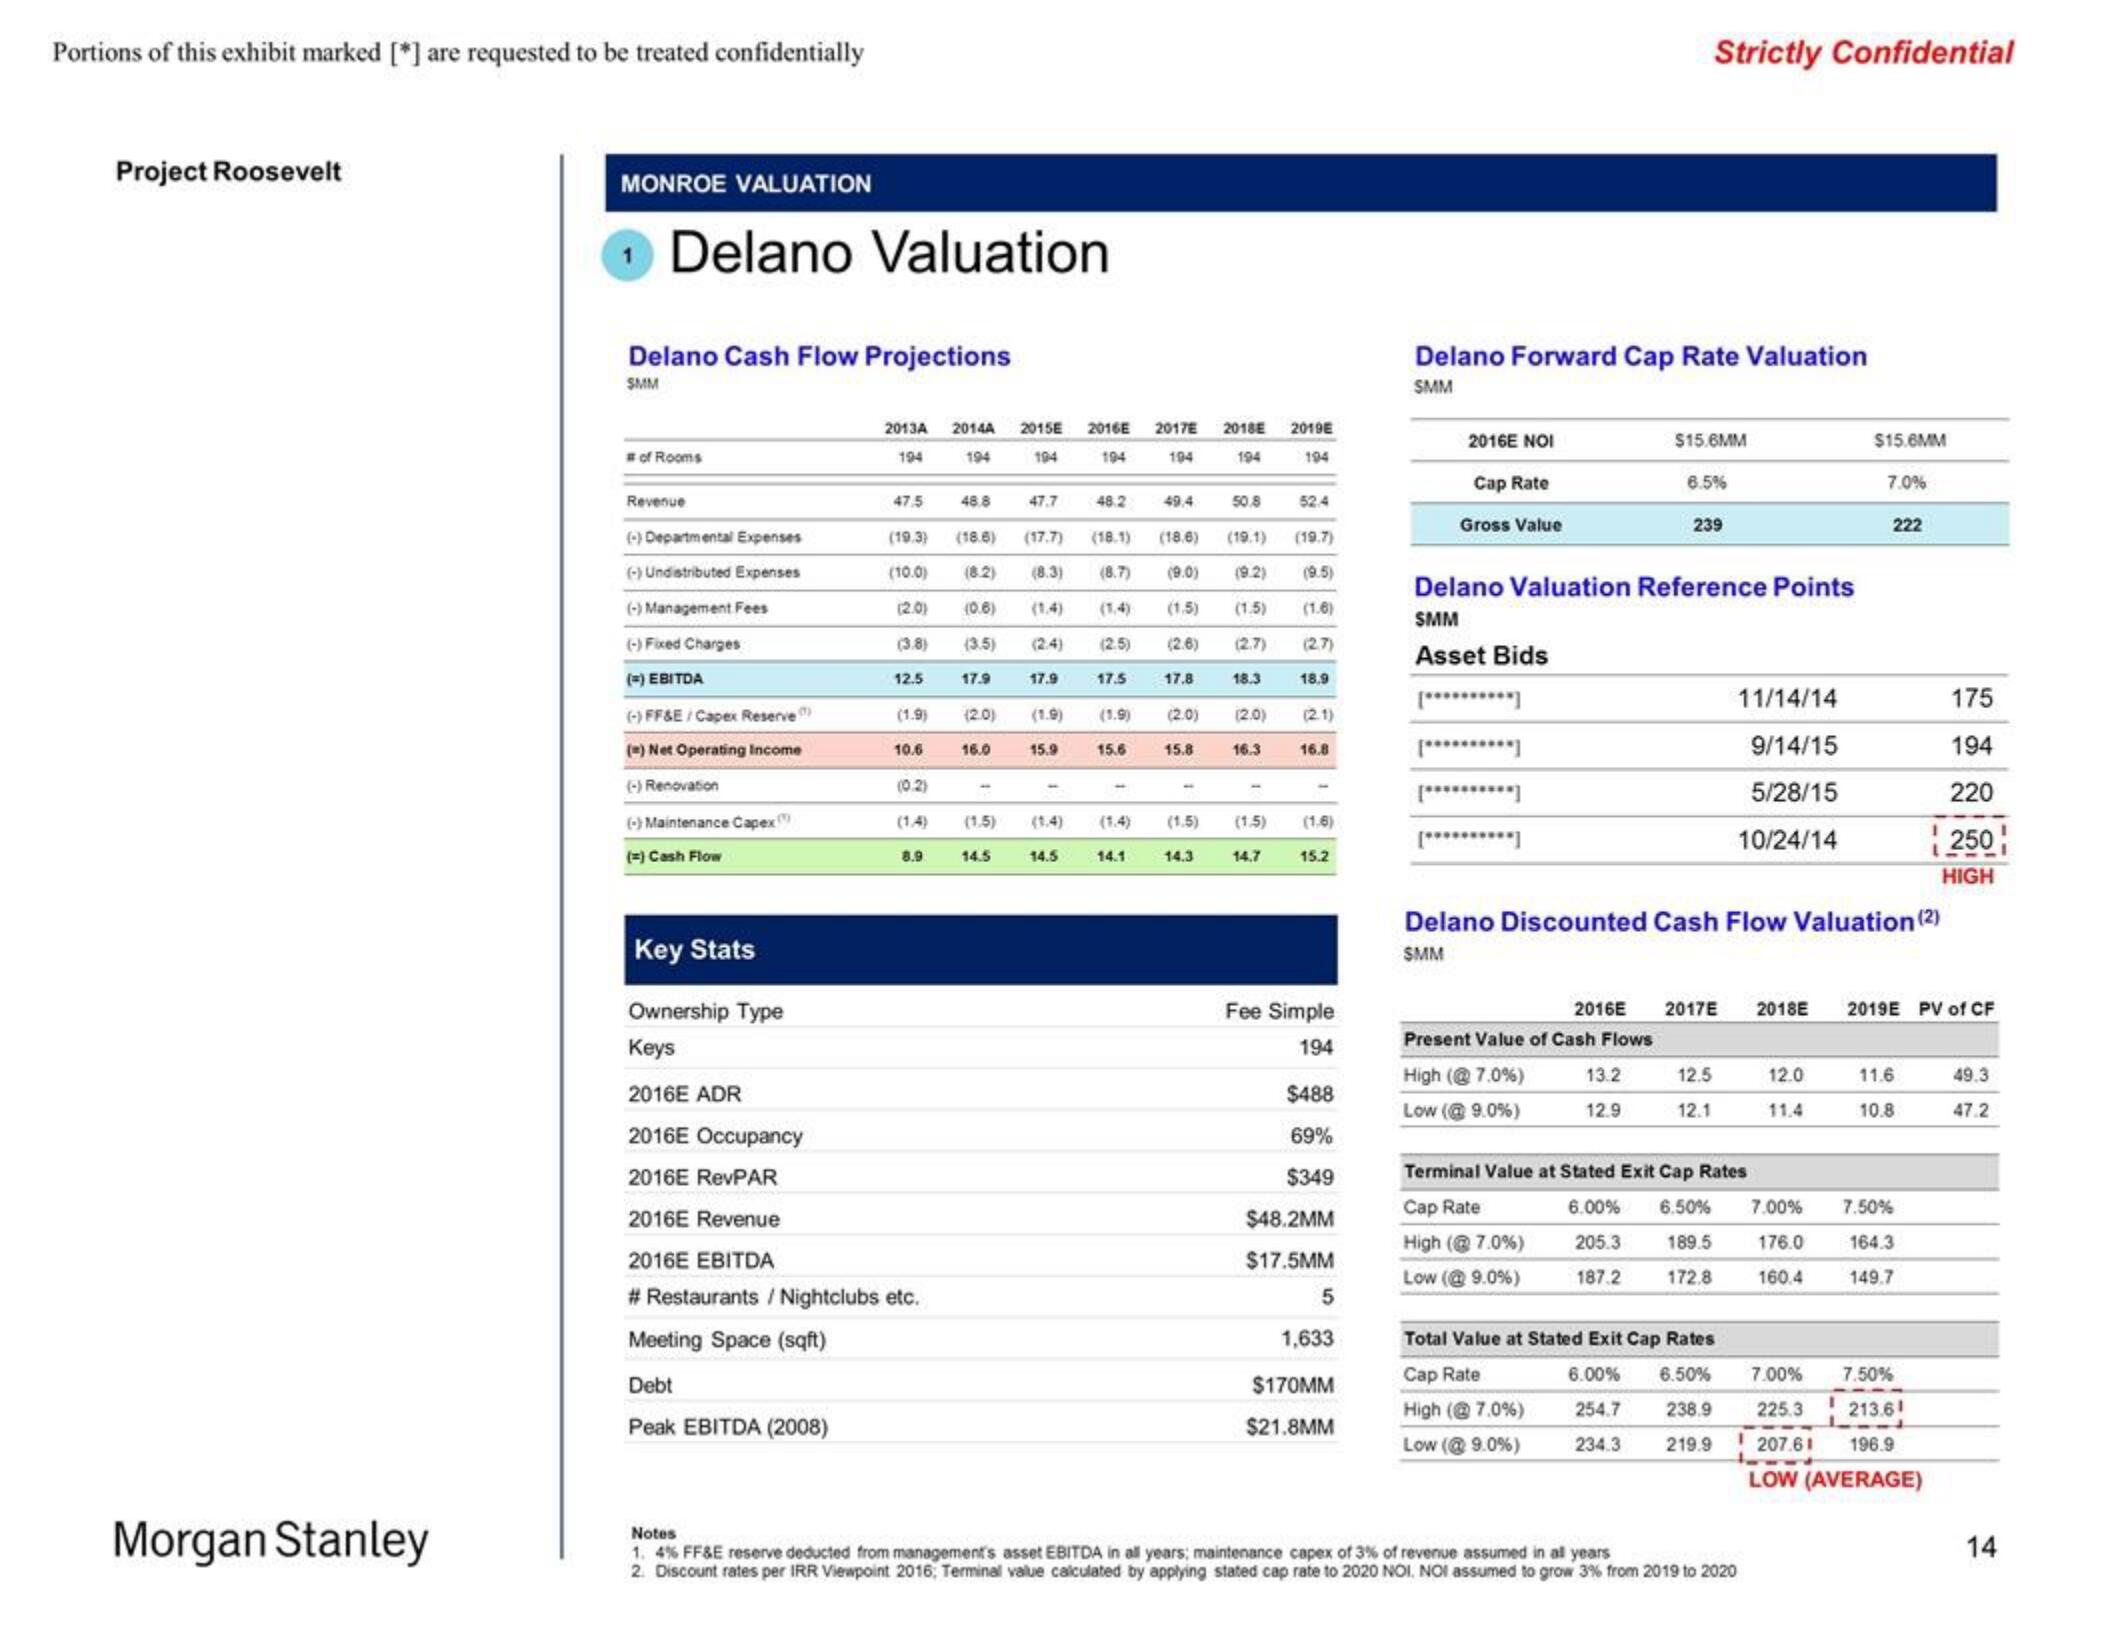
Delano Valuation
Delano Cash Flow Projections
SMM
# of Rooms
Revenue
(-) Departmental Expenses
(-)Undistributed Expenses
(-) Management Fees
(-) Fixed Charges
(=) EBITDA
(-) FF&E / Capex Reserve
(2) Net Operating Income
(-) Renovation
(-) Maintenance Capex
(=) Cash Flow
2013A 2014A 2015E
194
194
47.5
12.5
(19.3) (18.6)
(10.0) (8.2)
(2.0)
(3.8)
(1.9)
10.6
(0.2)
(1.4)
8.9
Key Stats
Ownership Type
Keys
2016E ADR
2016E Occupancy
2016E RevPAR
2016E Revenue
2016E EBITDA
# Restaurants /Nightclubs etc.
Meeting Space (sqft)
Debt
Peak EBITDA (2008)
48.8
47.7
(17.7) (18.1) (18.6)
(8.3) (8.7)
(0.6) (1.4) (1.4)
(3.5)
(2:4) (2.5)
17.9
(2.0)
16.0
(1.5)
14.5
17.9
15.9
2016E 2017E
194
194
14.5
48.2
17.5
15.6
(1.4)
49.4
(1.9) (2.0)
14.1
17.8
(19.1) (19.7)
(9.0) (9.2) (9.5)
(1.5) (1.5) (1.6)
(2.6) (2.7) (27)
15.8
(1.5)
2018E 2019E
194
194
14.3
50.8
18.3
(2.0)
16.3
(1.5)
52.4
14.7
18.9
(2.1)
16.8
(1.6)
15.2
Fee Simple
194
$488
69%
$349
$48.2MM
$17.5MM
5
1,633
$170MM
$21.8MM
Delano Forward Cap Rate Valuation
SMM
2016E NOI
Cap Rate
Gross Value
[**********]
Strictly Confidential
$15.6MM
Delano Valuation Reference Points
SMM
Asset Bids
Present Value of Cash Flows
High (@ 7.0%)
Low (@9.0%)
6.5%
13.2
12.9
239
12.5
12.1
11/14/14
9/14/15
5/28/15
10/24/14
Delano Discounted Cash Flow Valuation (2)
SMM
2016E 2017E 2018E 2019 PV of CF
Terminal Value at Stated Exit Cap Rates
Cap Rate
High (@ 7.0%)
Low (@9.0%)
6.00% 6.50%
205.3 189.5
187.2 172.8
Total Value at Stated Exit Cap Rates
Cap Rate
High (@7.0%)
Low (@ 9.0%)
12.0
11.4
Notes
1. 4% FF&E reserve deducted from management's asset EBITDA in all years; maintenance capex of 3% of revenue assumed in all years
2. Discount rates per IRR Viewpoint 2016, Terminal value calculated by applying stated cap rate to 2020 NOI. NOI assumed to grow 3% from 2019 to 2020
$15.6MM
7.0%
7.00%
176.0
160.4
222
6.00% 6.50% 7.00%
254.7 238.9
234.3 219.9
11.6
10.8
7.50%
164.3
149.7
7.50%
225.3 213.61
112
1 207.61 196.9
LOW (AVERAGE)
175
194
220
250
HIGH
49.3
47.2
14View entire presentation