Pathward Financial Results Presentation Deck
Interest Rate Risk Management
18
Earning Asset Pricing Attributes¹
35%
20%
5%
10%
-10%
23%
61%
12-Month Interest Rate Sensitivity
from Base Net Interest Income
6%
Fixed Rate > 1 Year
Fixed Rate < 1 Year
Floating or Variable
Federal Reserve
Bank Deposits
(Floating or Variable)
¹ Fixed rate securities, loans and leases are shown for contractual periods.
Parallel Shock ■Ramp ■Alternative Year 1
+100
H
-100
+200
+300
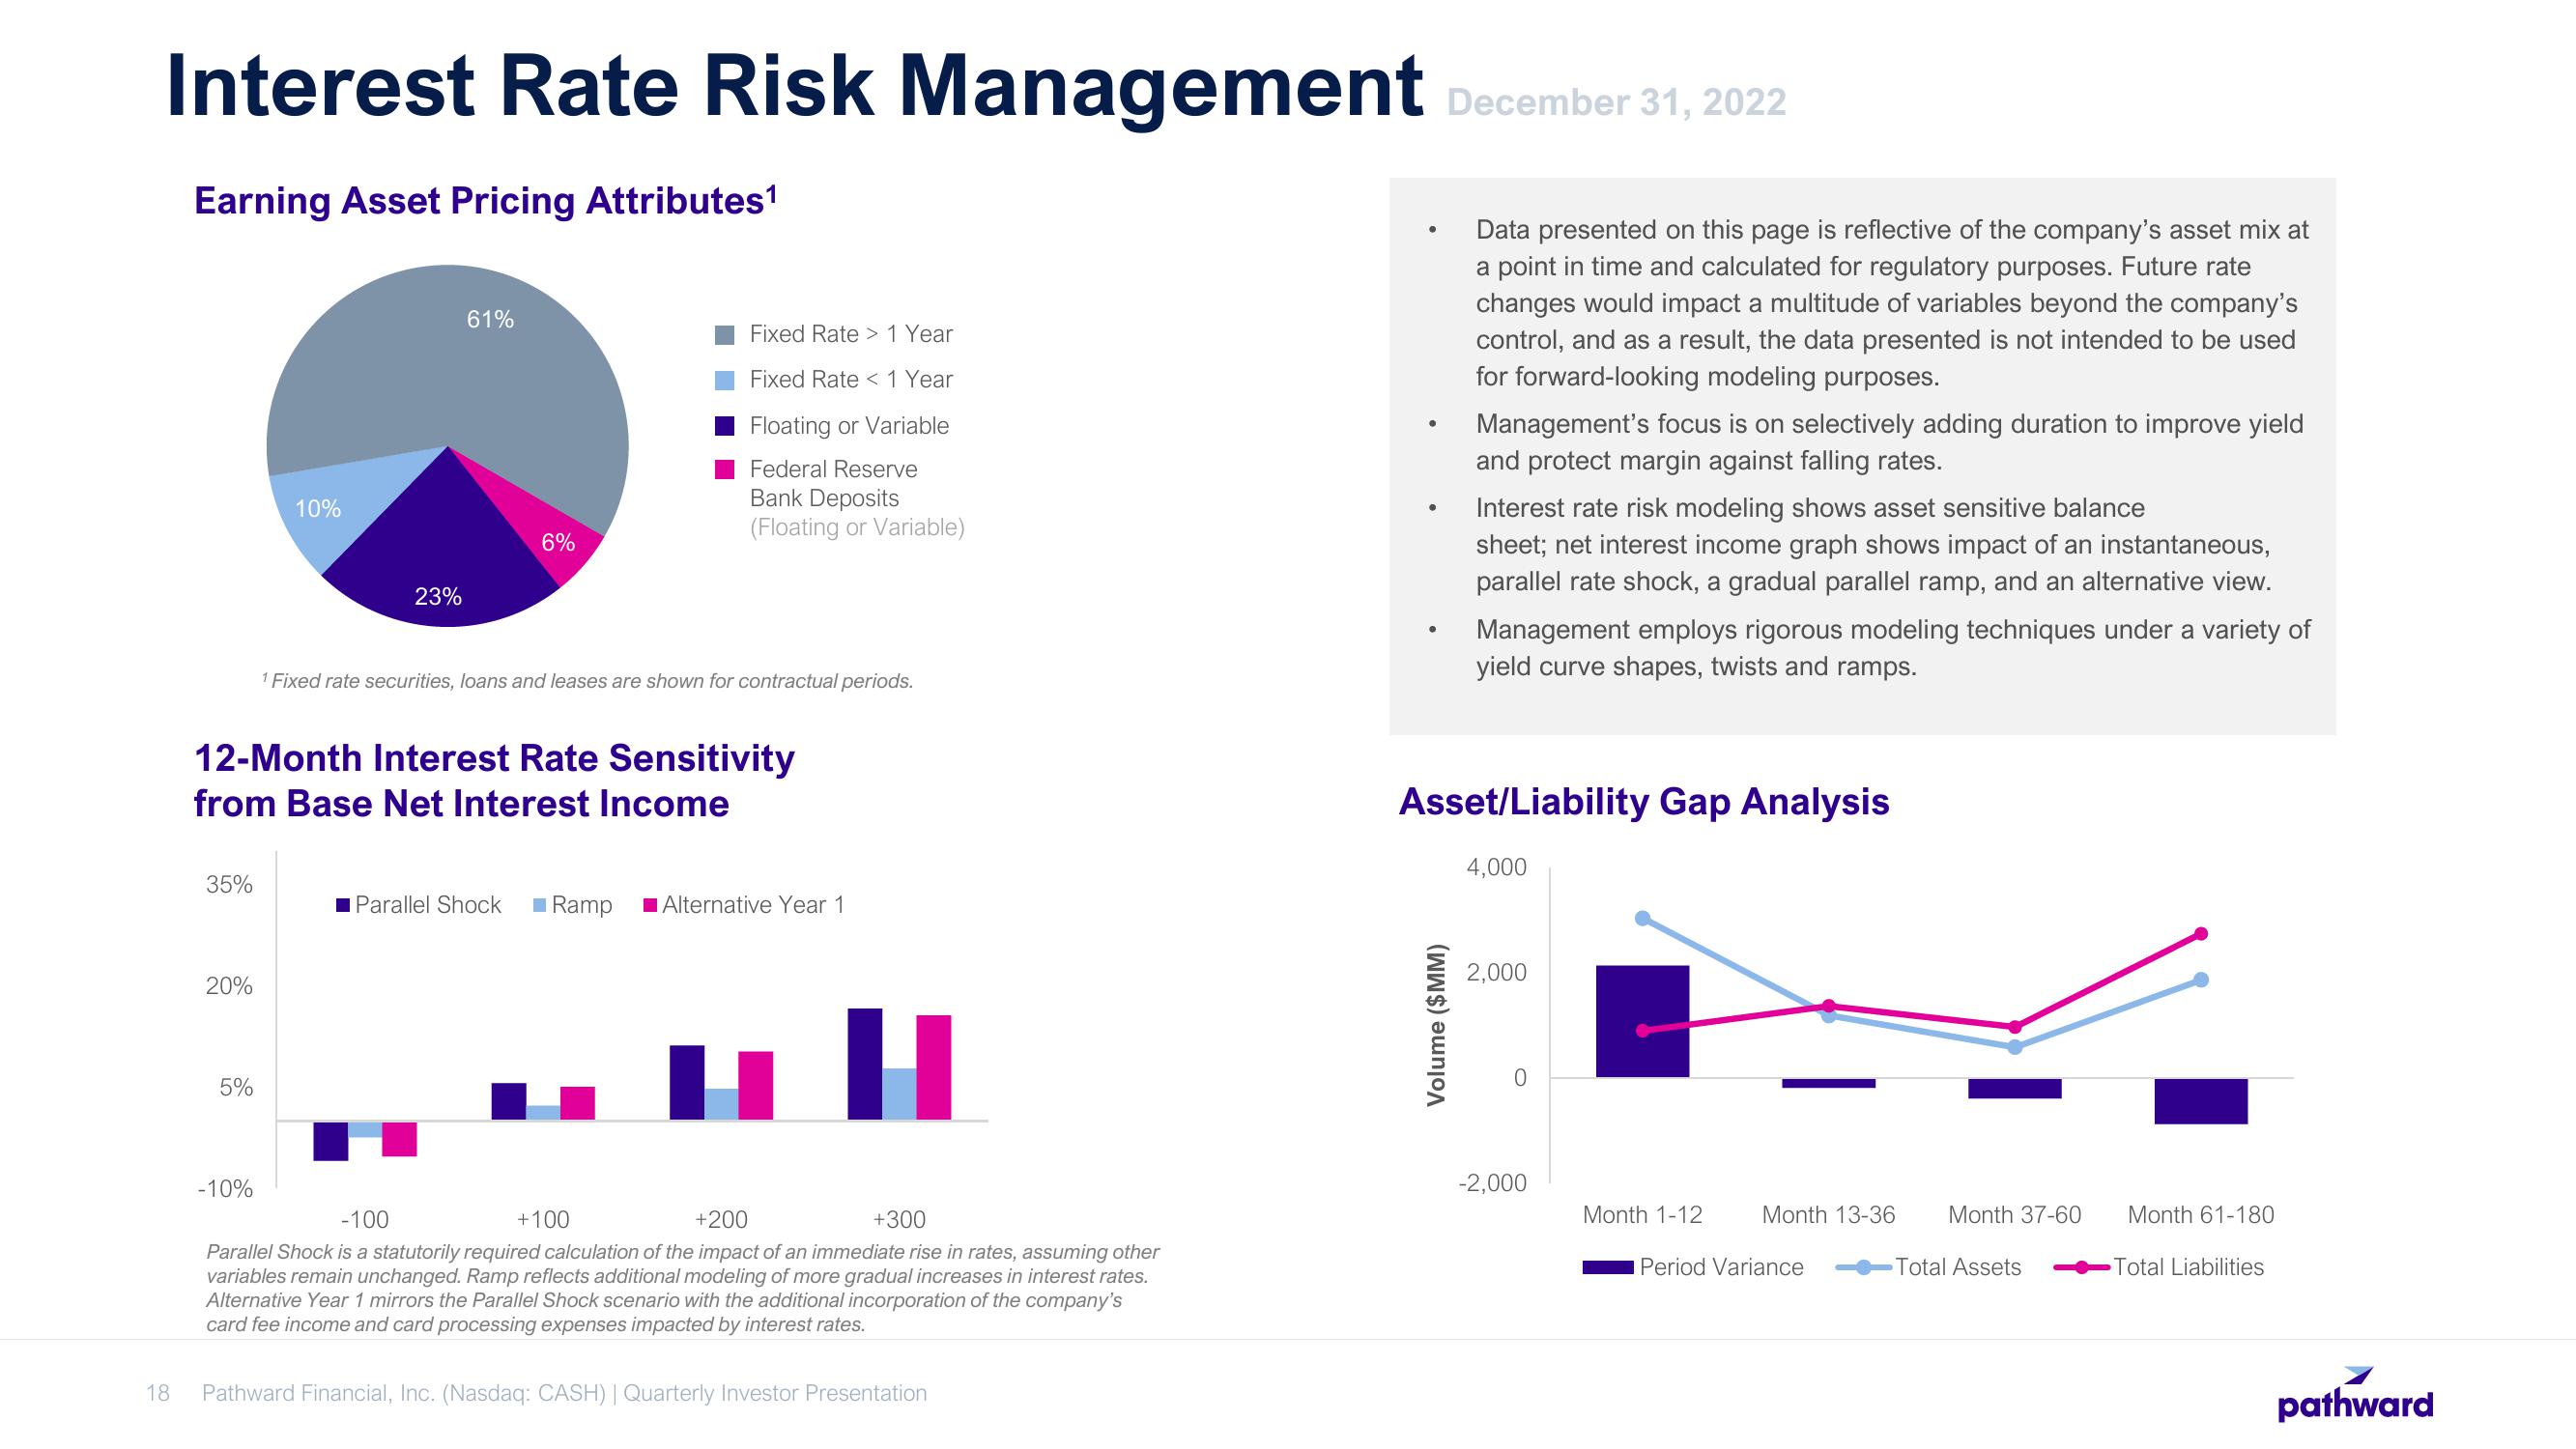
Parallel Shock is a statutorily required calculation of the impact of an immediate rise in rates, assuming other
variables remain unchanged. Ramp reflects additional modeling of more gradual increases in interest rates.
Alternative Year 1 mirrors the Parallel Shock scenario with the additional incorporation of the company's
card fee income and card processing expenses impacted by interest rates.
Pathward Financial, Inc. (Nasdaq: CASH) | Quarterly Investor Presentation
December 31, 2022
Data presented on this page is reflective of the company's asset mix at
a point in time and calculated for regulatory purposes. Future rate
changes would impact a multitude of variables beyond the company's
control, and as a result, the data presented is not intended to be used
for forward-looking modeling purposes.
Volume ($MM)
Management's focus is on selectively adding duration to improve yield
and protect margin against falling rates.
Interest rate risk modeling shows asset sensitive balance
sheet; net interest income graph shows impact of an instantaneous,
parallel rate shock, a gradual parallel ramp, and an alternative view.
Management employs rigorous modeling techniques under a variety of
yield curve shapes, twists and ramps.
Asset/Liability Gap Analysis
4,000
2,000
-2,000
Month 1-12
Month 13-36
Period Variance
Month 37-60
-Total Assets
Month 61-180
Total Liabilities
pathwardView entire presentation