Overstock Results Presentation Deck slide image

Overstock Results Presentation Deck

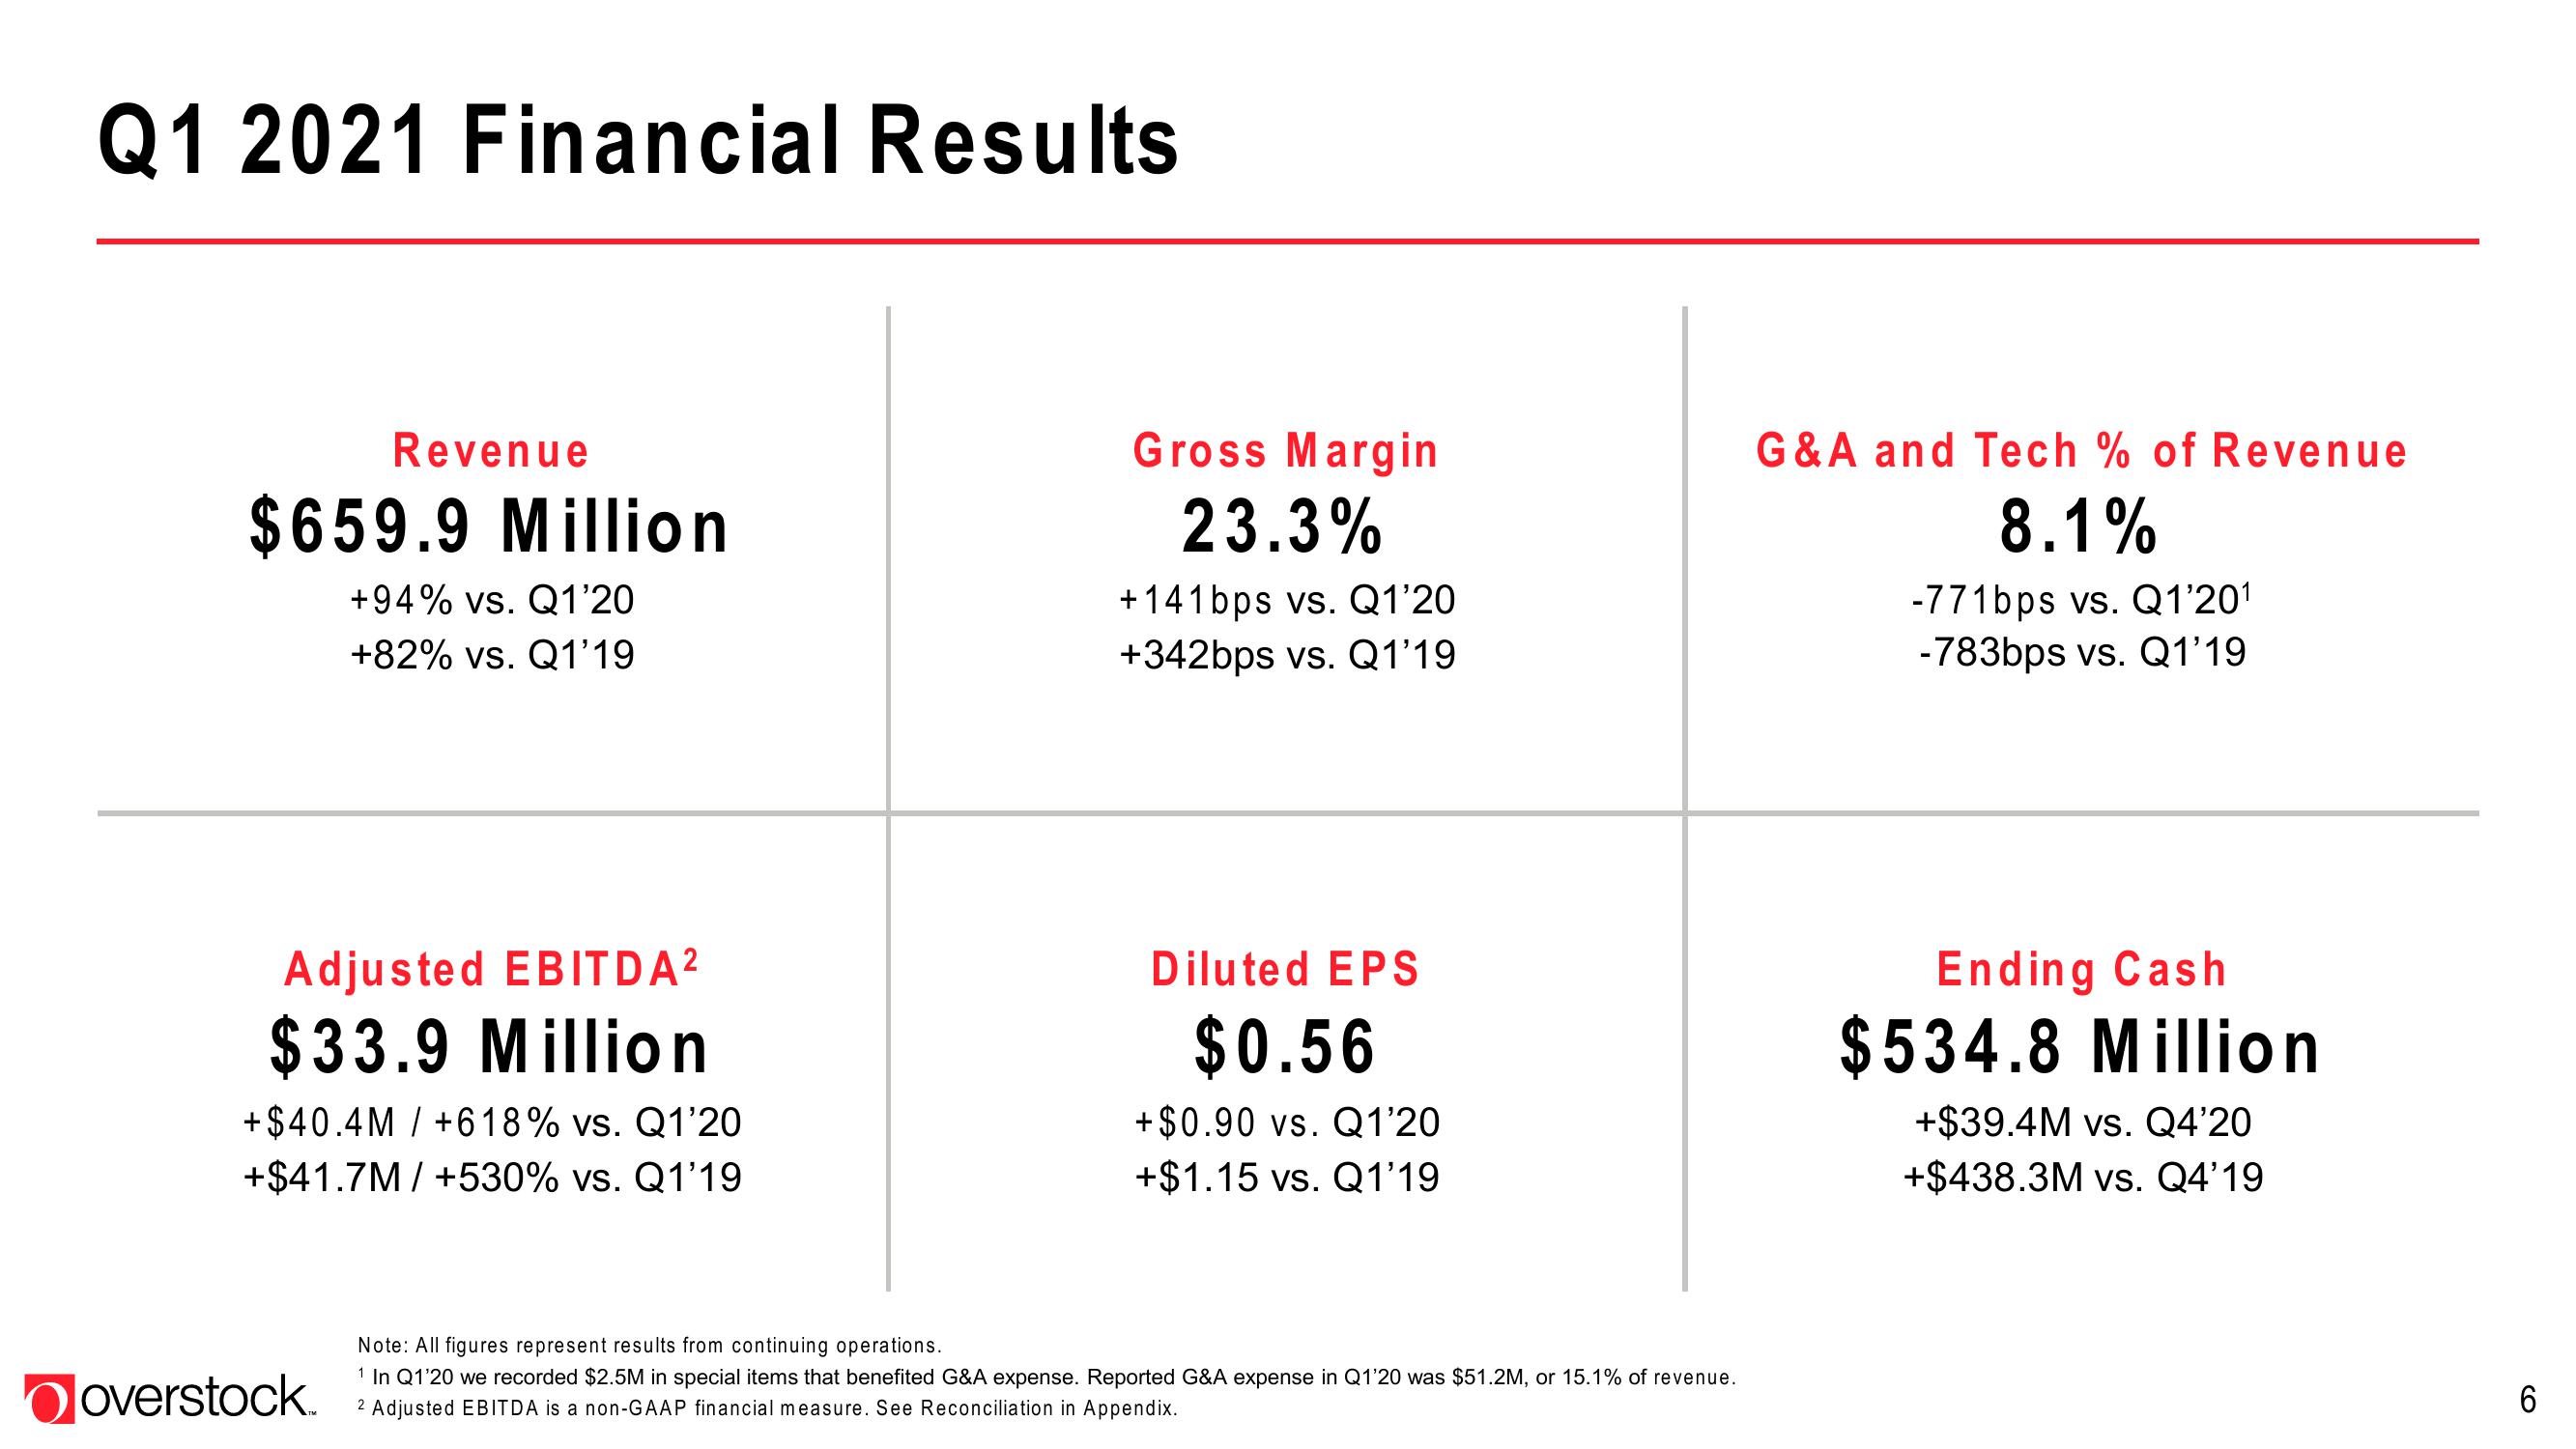
Q1 2021 Financial Results Revenue $659.9 Million +94% vs. Q1'20 +82% vs. Q1'19 Adjusted EBITDA² $33.9 Million +$40.4M / +618% vs. Q1'20 +$41.7M/+530% vs. Q1'19 overstock. Gross Margin 23.3% +141bps vs. Q1'20 +342bps vs. Q1'19 Diluted EPS $0.56 +$0.90 vs. Q1'20 +$1.15 vs. Q1'19 Note: All figures represent results from continuing operations. 1 In Q1'20 we recorded $2.5M in special items that benefited G&A expense. Reported G&A expense in Q1'20 was $51.2M, or 15.1% of revenue. 2 Adjusted EBITDA is a non-GAAP financial measure. See Reconciliation in Appendix. G&A and Tech % of Revenue 8.1% -771bps vs. Q1'20¹ -783bps vs. Q1'19 Ending Cash $534.8 Million +$39.4M vs. Q4'20 +$438.3M vs. Q4'19 6
View entire presentation