Pinterest Results Presentation Deck
Adjusted EBITDA reconciliation
Reconciliation of net income (loss) to adjusted EBITDA
(in millions)
Net income (loss)
Depreciation and amortization
Share-based compensation
Interest income (expense), net
Other expense (income), net
Provision for (benefit from) income taxes
Restructuring costs
Non-cash charitable contribution
Adjusted EBITDA
September 30, 2022
$(65.2)
10.5
136.2
(8.9)
9.7
(5.0)
0.0
0.0
$77.3
Three months ended
December 31, 2022
$17.5
19.6
170.3
(16.6)
(6.3)
11.3
0.0
0.0
$195.8
March 31, 2023
$(208.6)
6.2
143.1
(24.9)
(0.3)
(9.9)
121.3
0.0
$27.0
© 2023 Pinterest. All rights reserved.
June 30, 2023
$(34.9)
5.1
169.6
(24.9)
(2.2)
(11.2)
5.6
0.0
$107.0
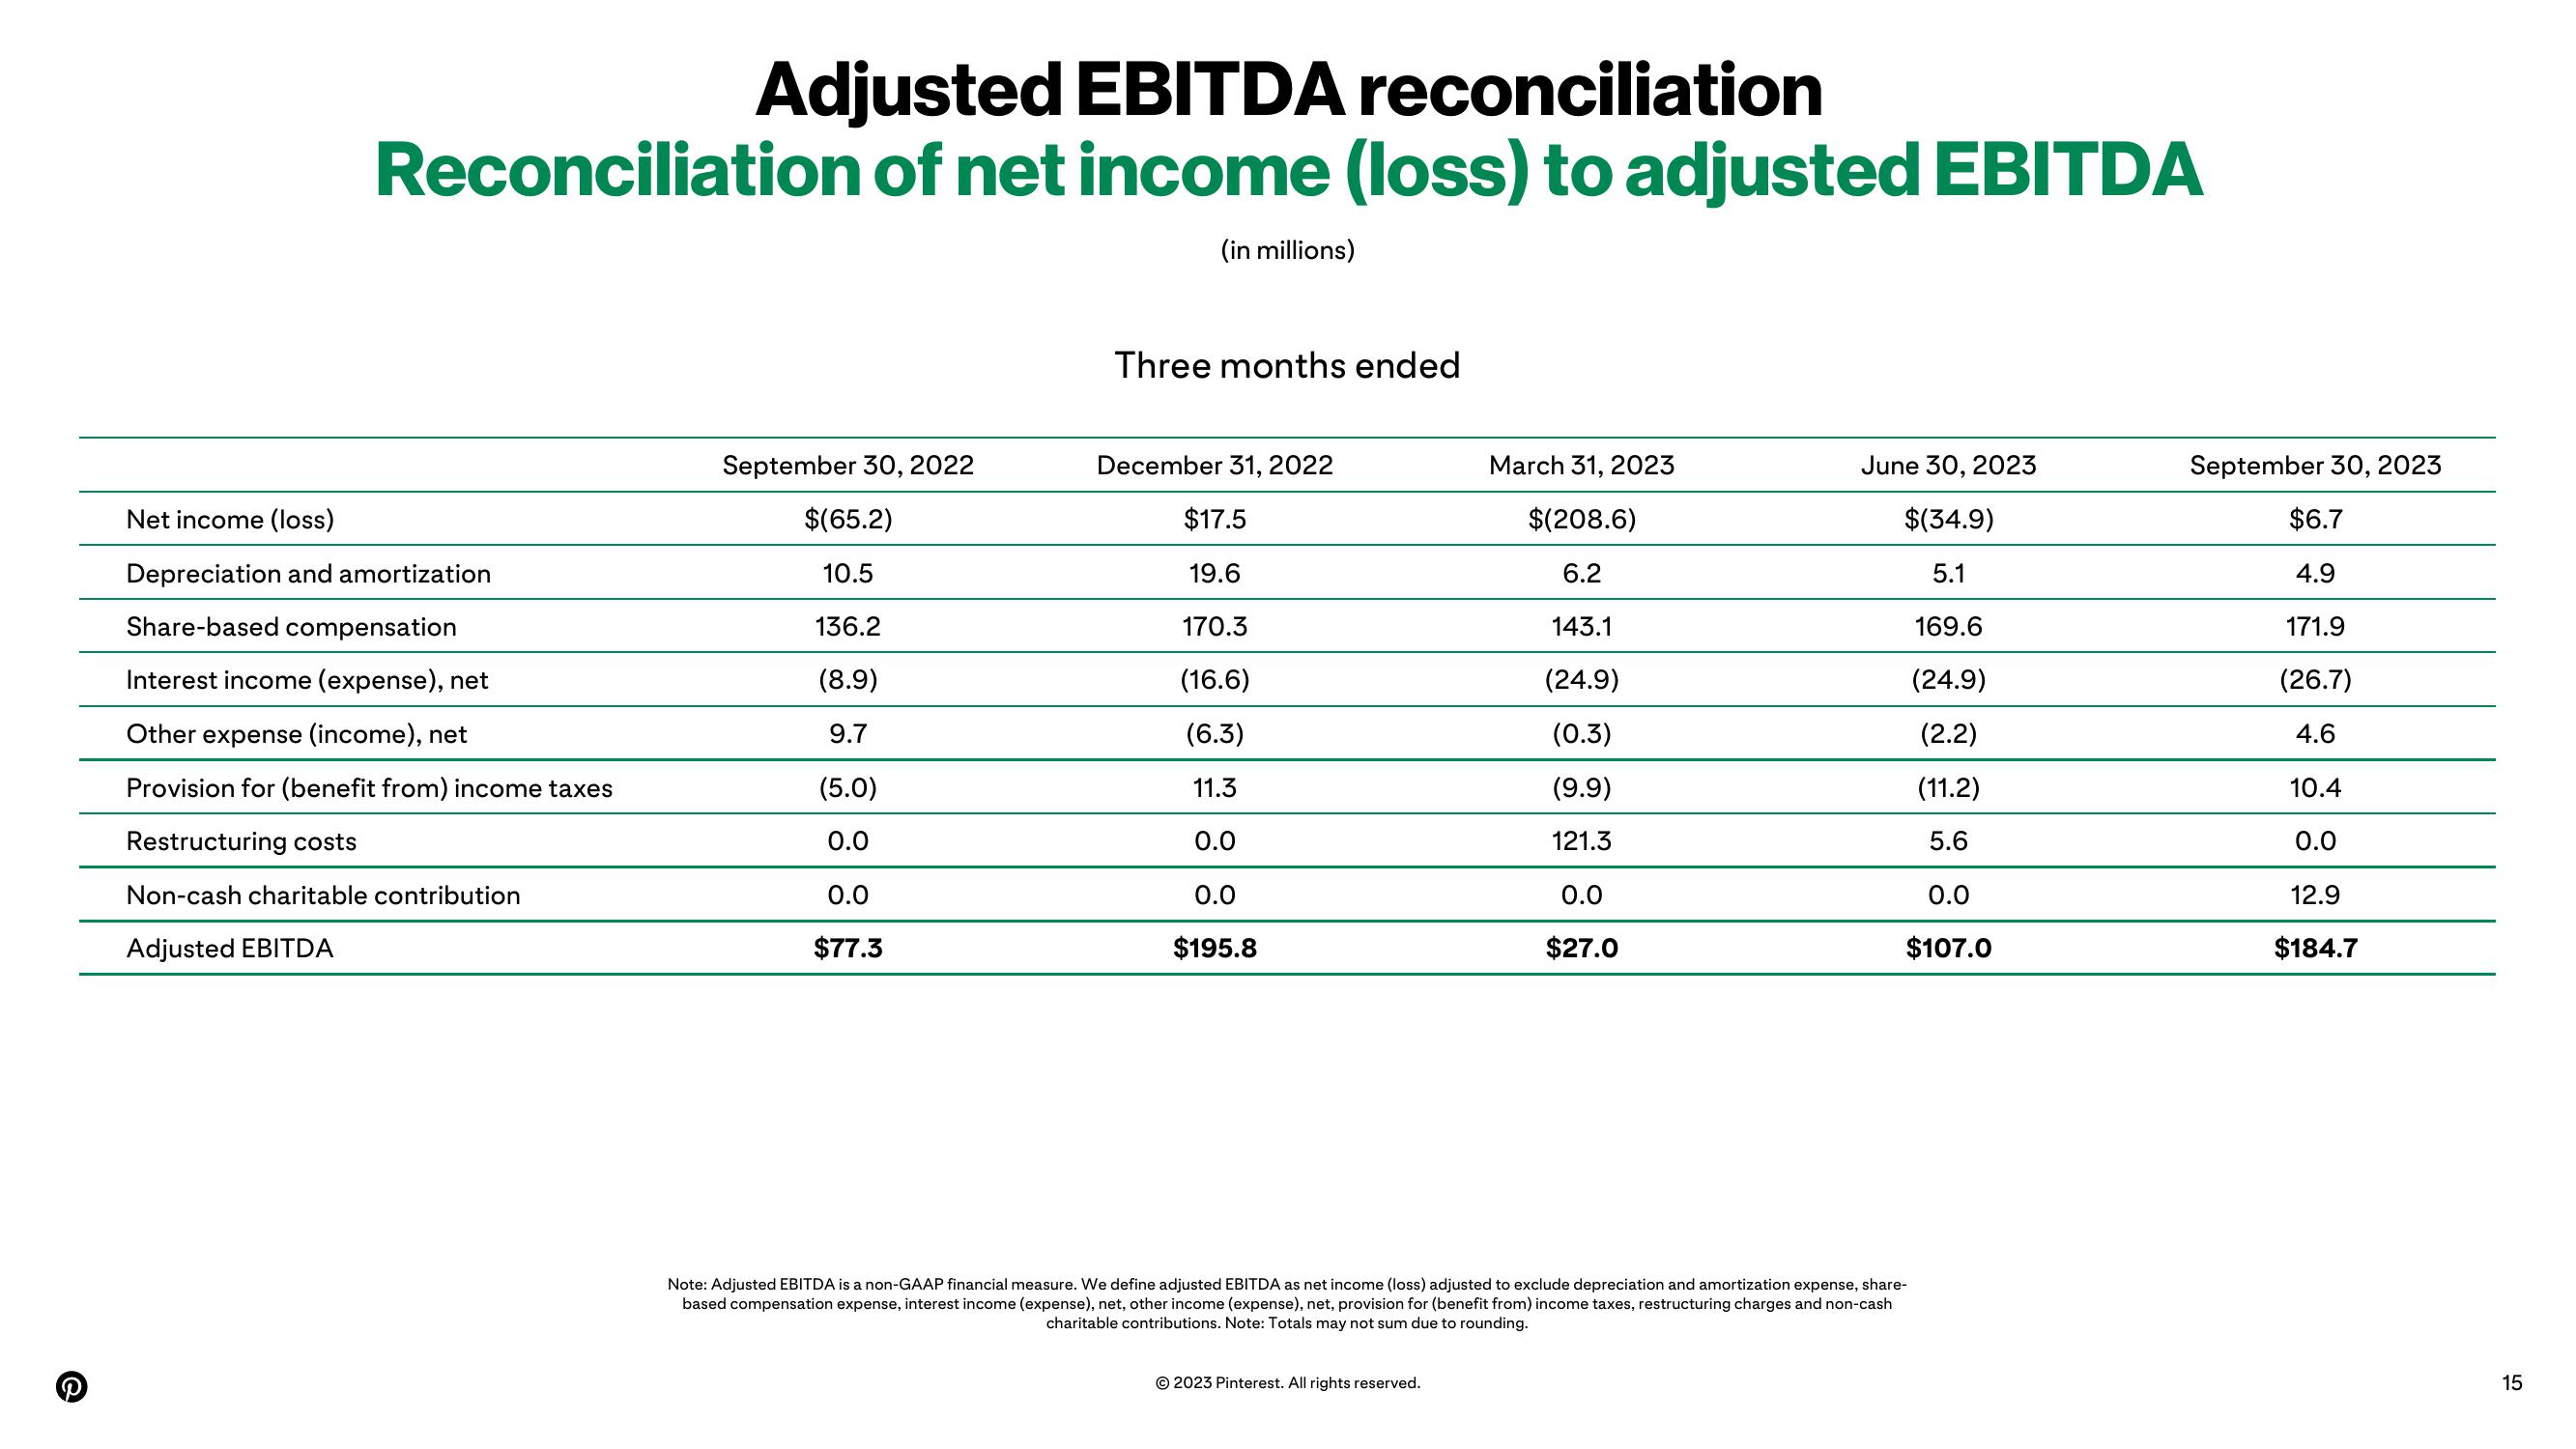
Note: Adjusted EBITDA is a non-GAAP financial measure. We define adjusted EBITDA as net income (loss) adjusted to exclude depreciation and amortization expense, share-
based compensation expense, interest income (expense), net, other income (expense), net, provision for (benefit from) income taxes, restructuring charges and non-cash
charitable contributions. Note: Totals may not sum due to rounding.
September 30, 2023
$6.7
4.9
171.9
(26.7)
4.6
10.4
0.0
12.9
$184.7
15View entire presentation