Zegna SPAC Presentation Deck
ZEGNA GROUP
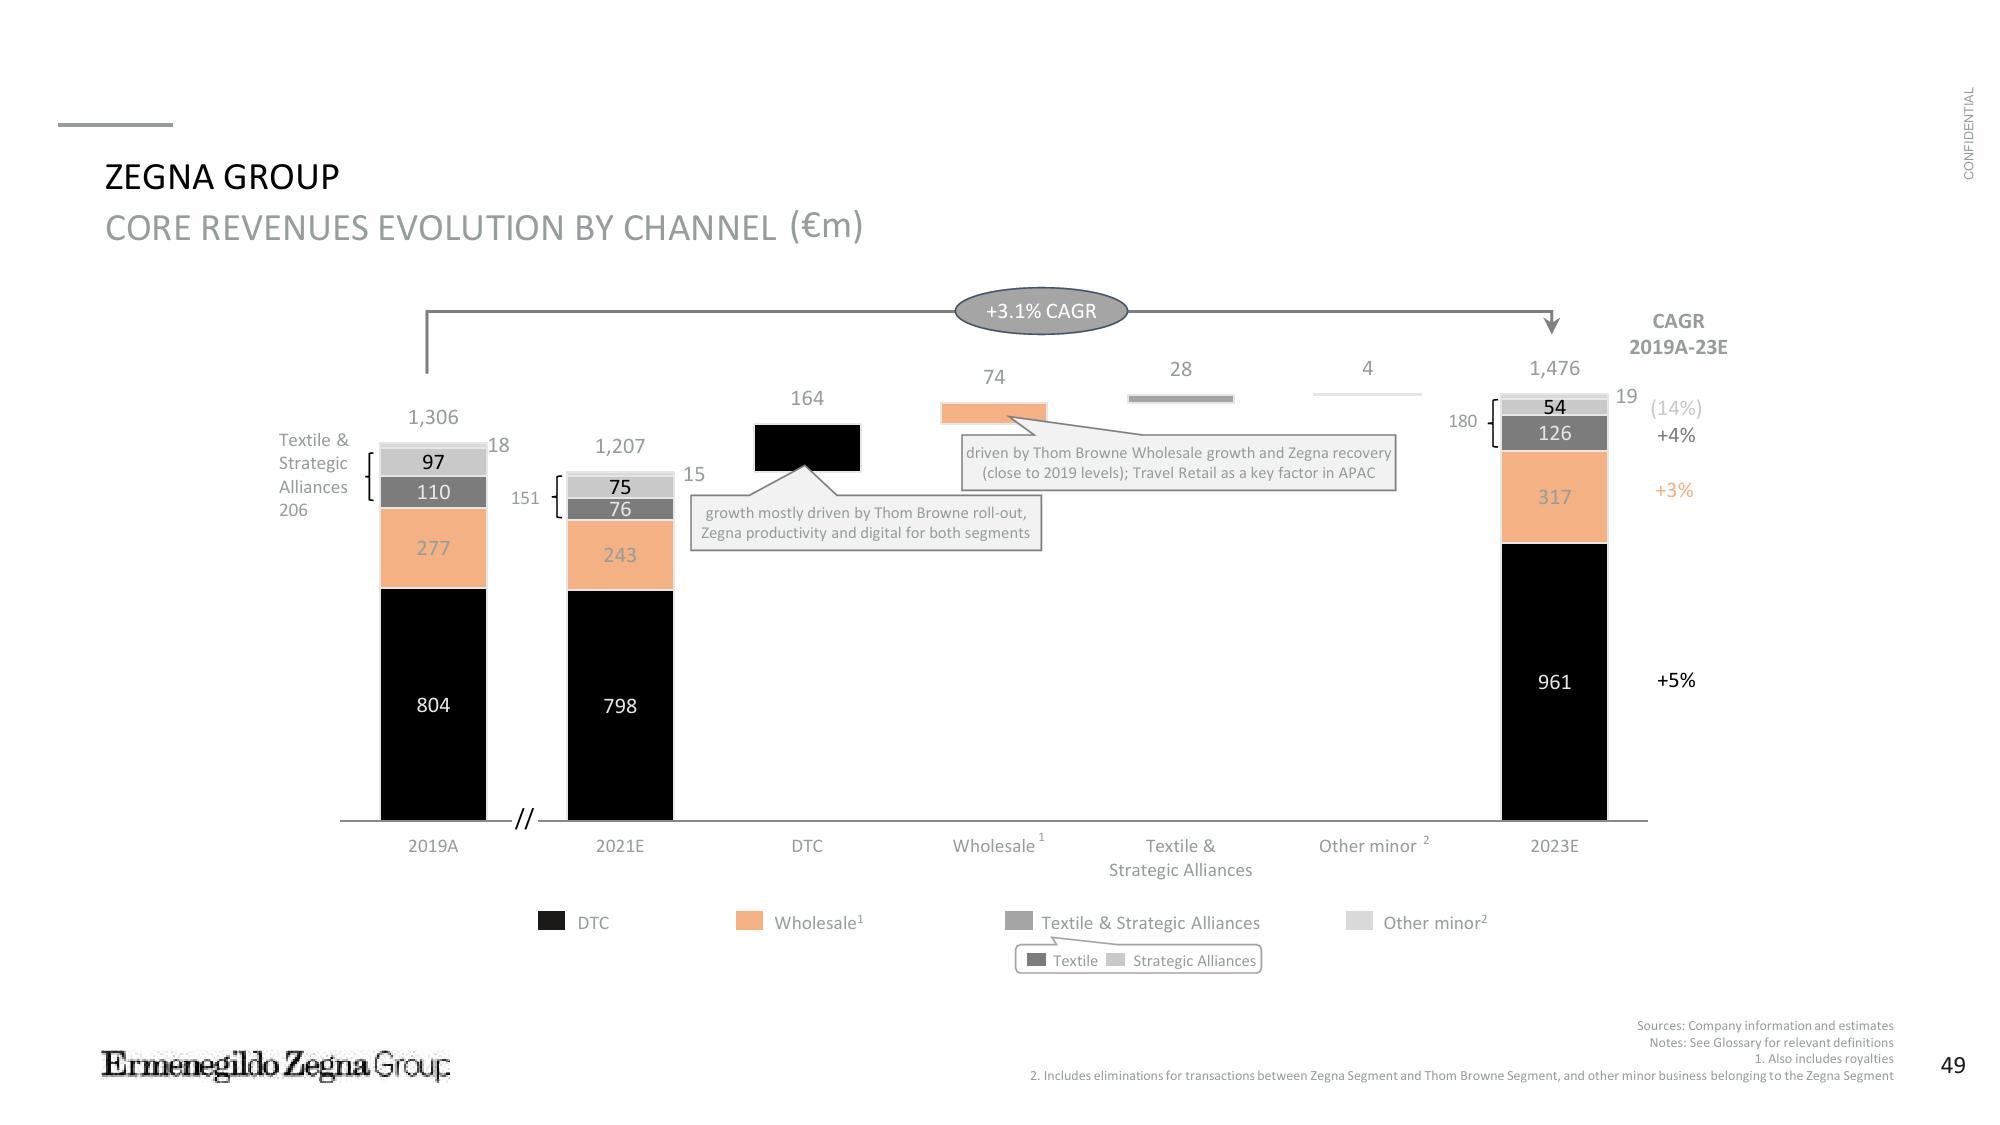
CORE REVENUES EVOLUTION BY CHANNEL (€m)
Textile &
Strategic
Alliances
206
1,306
97
110
277
804
2019A
Ermenegildo Zegna Group
18
151
T
1,207
75
76
243
798
2021E
DTC
15
164
DTC
+3.1% CAGR
Wholesale¹
74
growth mostly driven by Thom Browne roll-out,
Zegna productivity and digital for both segments
28
driven by Thom Browne Wholesale growth and Zegna recovery
(close to 2019 levels); Travel Retail as a key factor in APAC
Wholesale ¹
Textile &
Strategic Alliances
4
Textile & Strategic Alliances
Textile Strategic Alliances
Other minor ²
180
Other minor²
1,476
54
126
317
961
2023E
CAGR
2019A-23E
19
(14%)
+4%
+3%
+5%
Sources: Company information and estimates
Notes: See Glossary for relevant definitions.
1. Also includes royalties
2. Includes eliminations for transactions between Zegna Segment and Thom Browne Segment, and other minor business belonging to the Zegna Segment
CONFIDENTIAL
49View entire presentation