Main Street Capital Fixed Income Presentation Deck
Total Investment Portfolio
Diversity provides
structural protection to
investment portfolio,
revenue sources, income,
cash flows and
stakeholder dividends
Includes complementary LMM debt and equity investments, Private
Loan debt investments and Middle Market debt investments
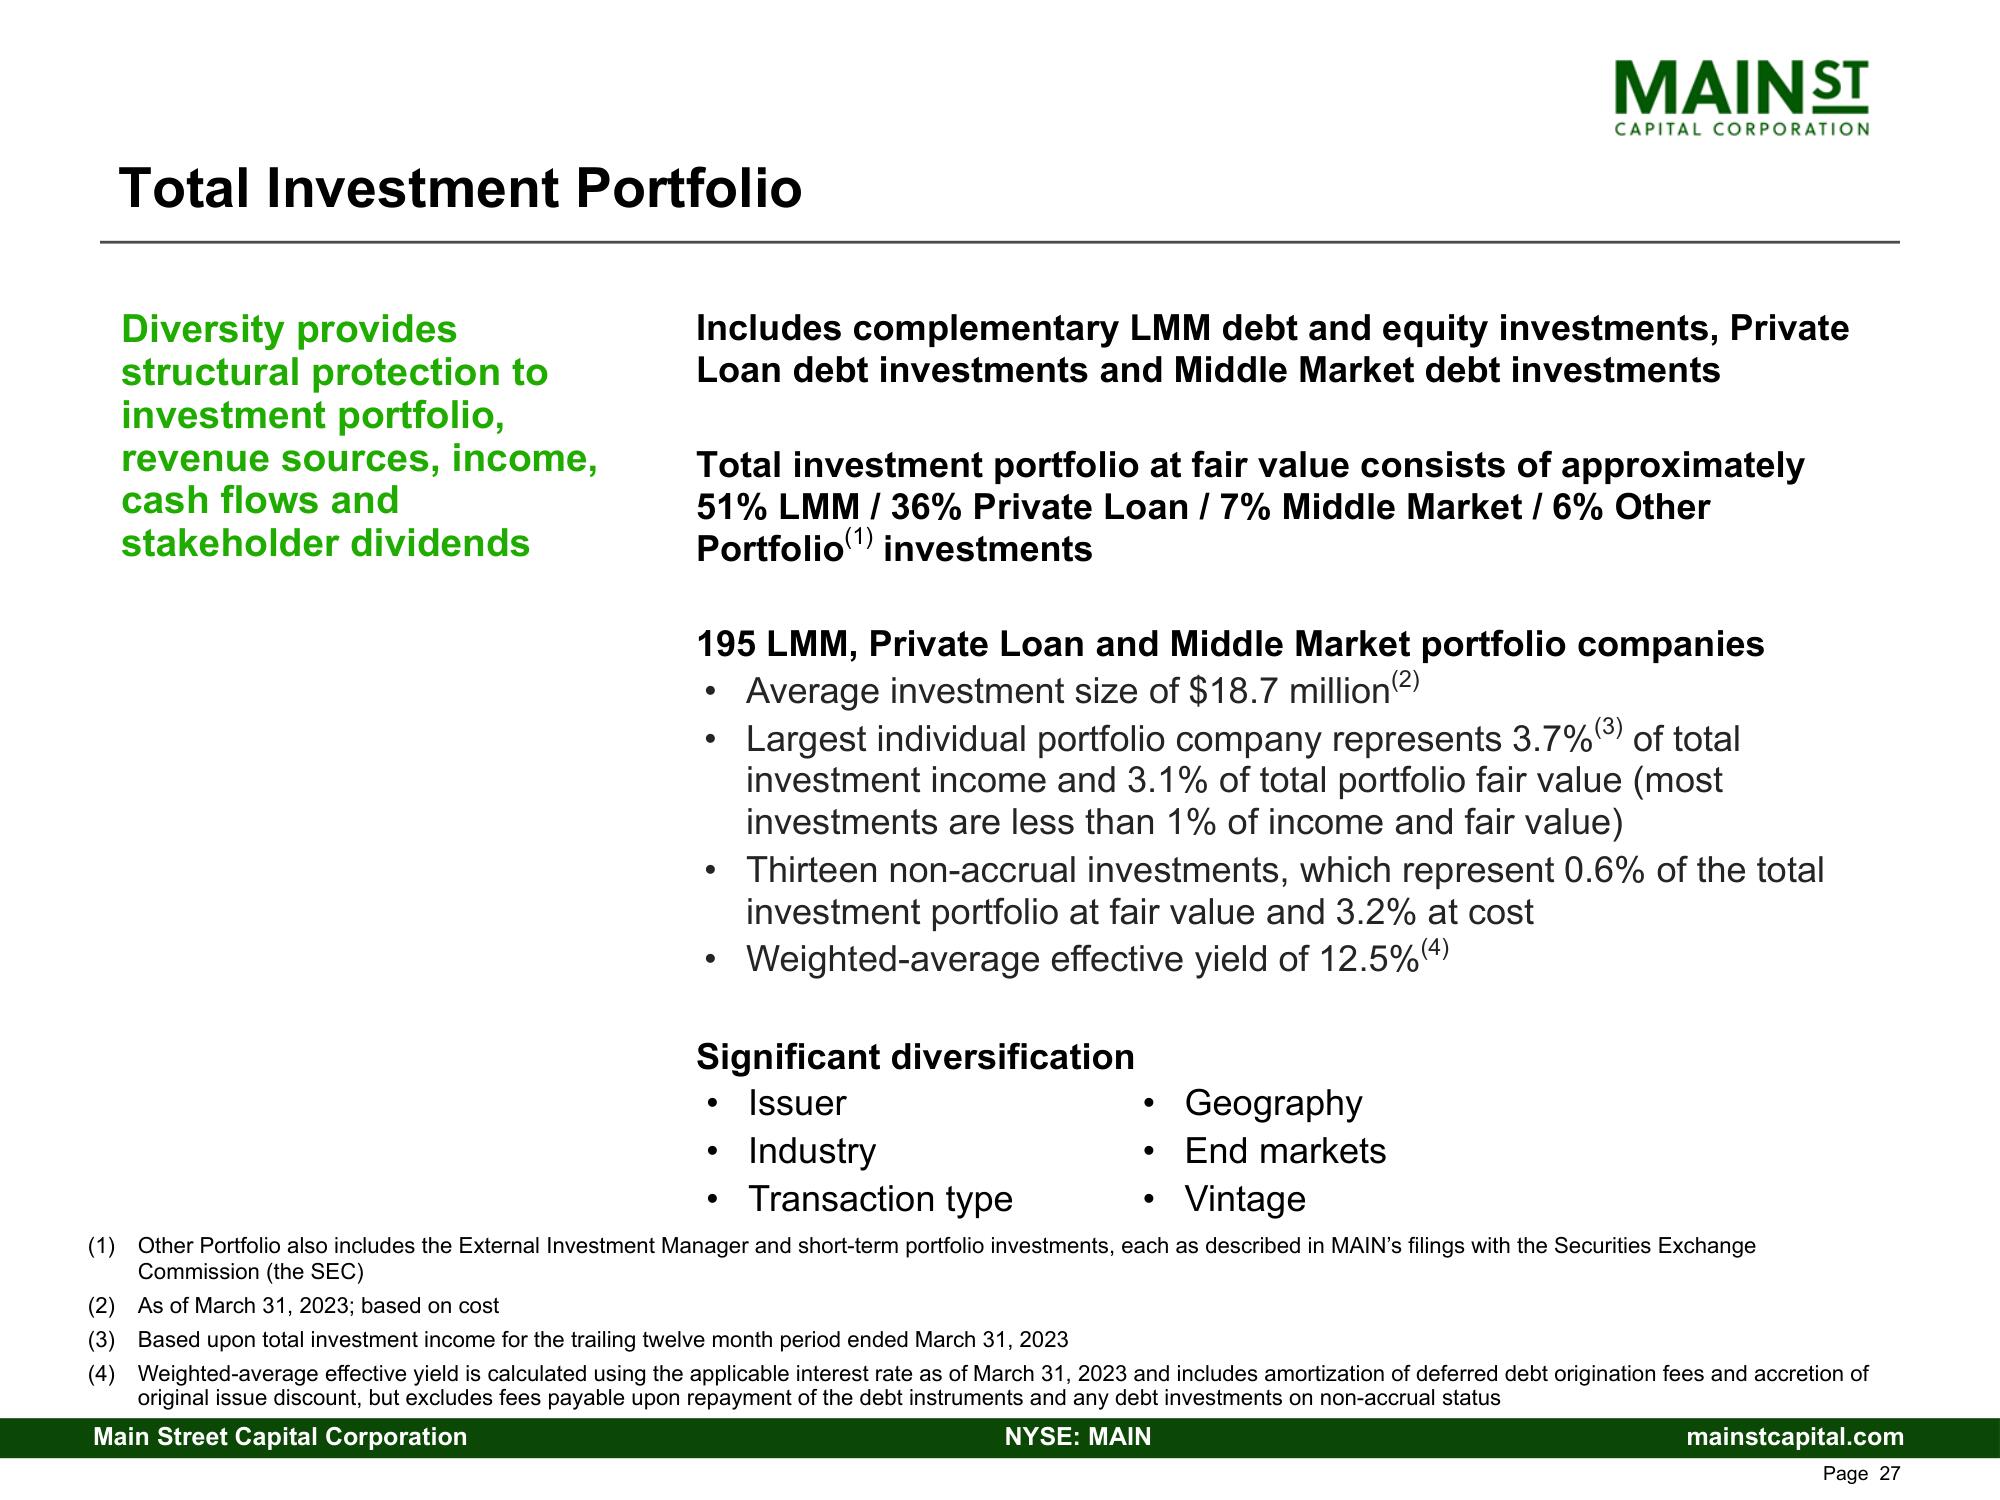
Total investment portfolio at fair value consists of approximately
51% LMM / 36% Private Loan / 7% Middle Market / 6% Other
Portfolio(¹) investments
●
195 LMM, Private Loan and Middle Market portfolio companies
Average investment size of $18.7 million (²)
●
●
●
●
MAIN ST
●
CAPITAL CORPORATION
●
Significant diversification
Issuer
Geography
Industry
End markets
Transaction type
Vintage
Other Portfolio also includes the External Investment Manager and short-term portfolio investments, each as described in MAIN's filings with the Securities Exchange
Commission (the SEC)
(3)
Largest individual portfolio company represents 3.7% of total
investment income and 3.1% of total portfolio fair value (most
investments are less than 1% of income and fair value)
Thirteen non-accrual investments, which represent 0.6% of the total
investment portfolio at fair value and 3.2% at cost
Weighted-average effective yield of 12.5% (4)
●
●
(1)
(2) As of March 31, 2023; based on cost
(3) Based upon total investment income for the trailing twelve month period ended March 31, 2023
(4) Weighted-average effective yield is calculated using the applicable interest rate as of March 31, 2023 and includes amortization of deferred debt origination fees and accretion of
original issue discount, but excludes fees payable upon repayment of the debt instruments and any debt investments on non-accrual status
Main Street Capital Corporation
NYSE: MAIN
mainstcapital.com
Page 27View entire presentation