Stem SPAC Presentation Deck
stem Gross Margins
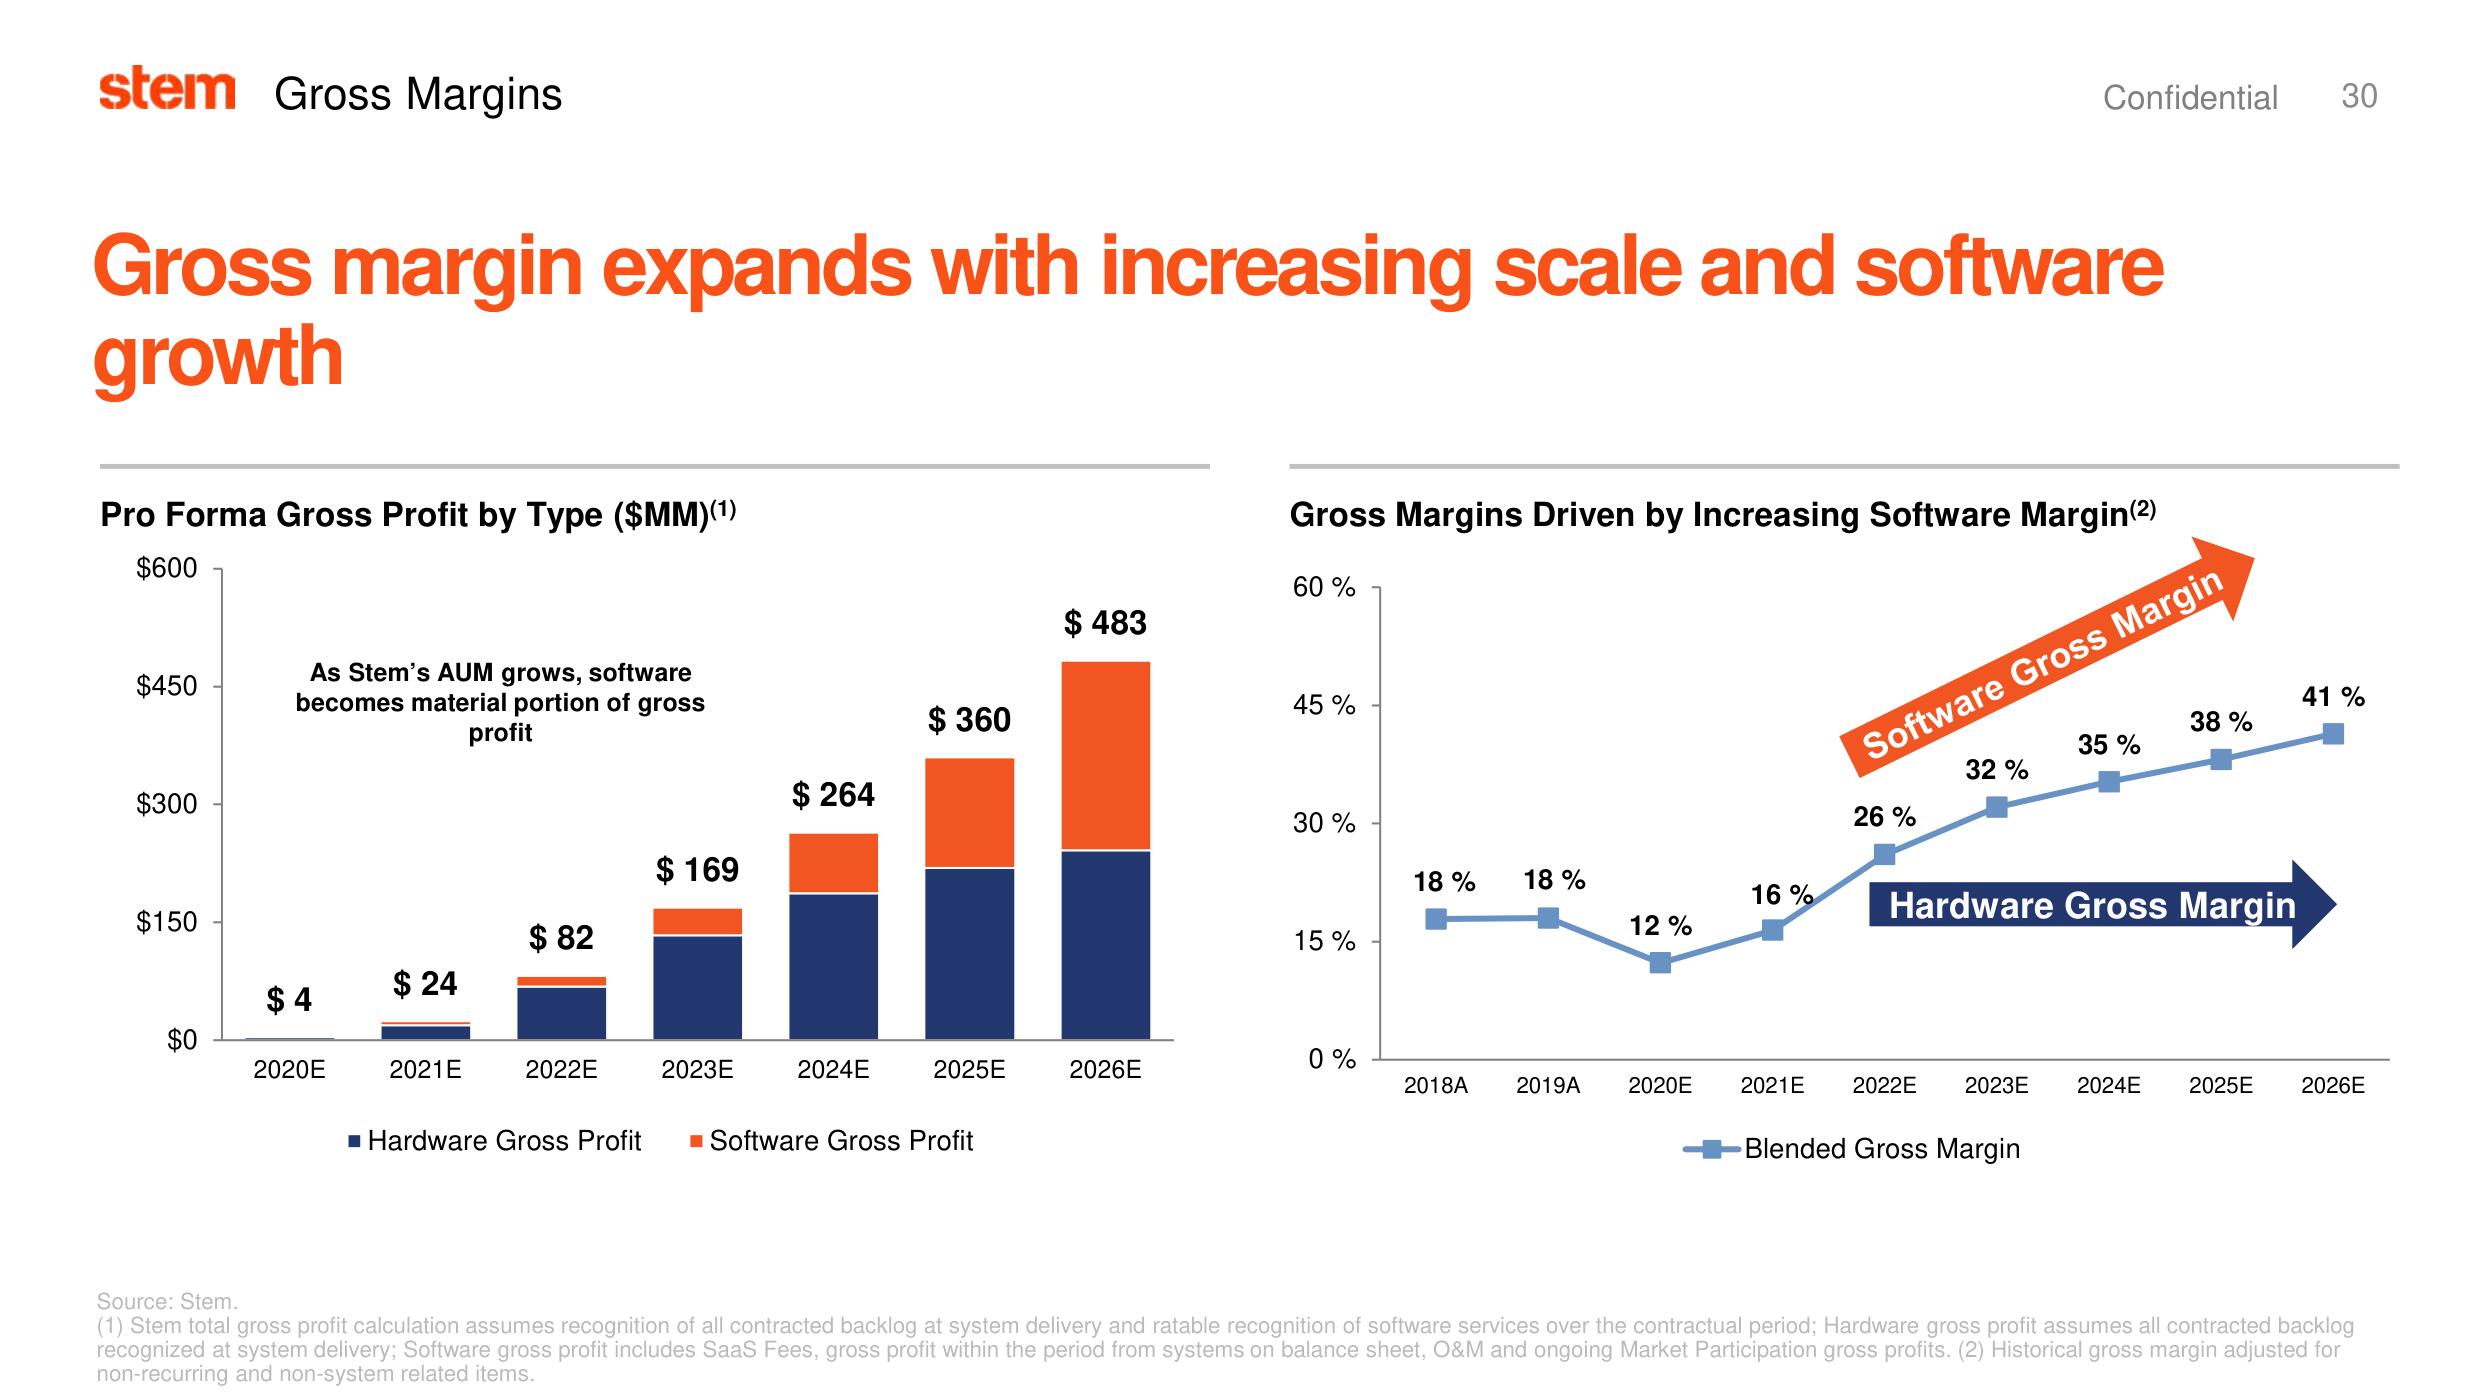
Gross margin expands with increasing scale and software
growth
Pro Forma Gross Profit by Type ($MM)(¹)
$600
$450
$300
$150
$0
As Stem's AUM grows, software
becomes material portion of gross
profit
$4
2020E
$ 24
2021E
$82
2022E
$169
2023E
$ 264
2024E
$360
2025E
■ Hardware Gross Profit ■ Software Gross Profit
$ 483
2026E
Gross Margins Driven by Increasing Software Margin(²)
60 %
45 %
30%
15%
0%
∞
18%
00
18 %
12%
2018A 2019A 2020E
16%
2021E
Confidential
26%
32%
Software Gross Margin
35 %
Blended Gross Margin
38%
Hardware Gross Margin
2022E 2023E 2024E
30
41%
2025E 2026E
Source: Stem.
(1) Stem total gross profit calculation assumes recognition of all contracted backlog at system delivery and ratable recognition of software services over the contractual period; Hardware gross profit assumes all contracted backlog
recognized at system delivery; Software gross profit includes SaaS Fees, gross profit within the period from systems on balance sheet, O&M and ongoing Market Participation gross profits. (2) Historical gross margin adjusted for
non-recurring and non-system related items.View entire presentation