Amplitude Results Presentation Deck
A
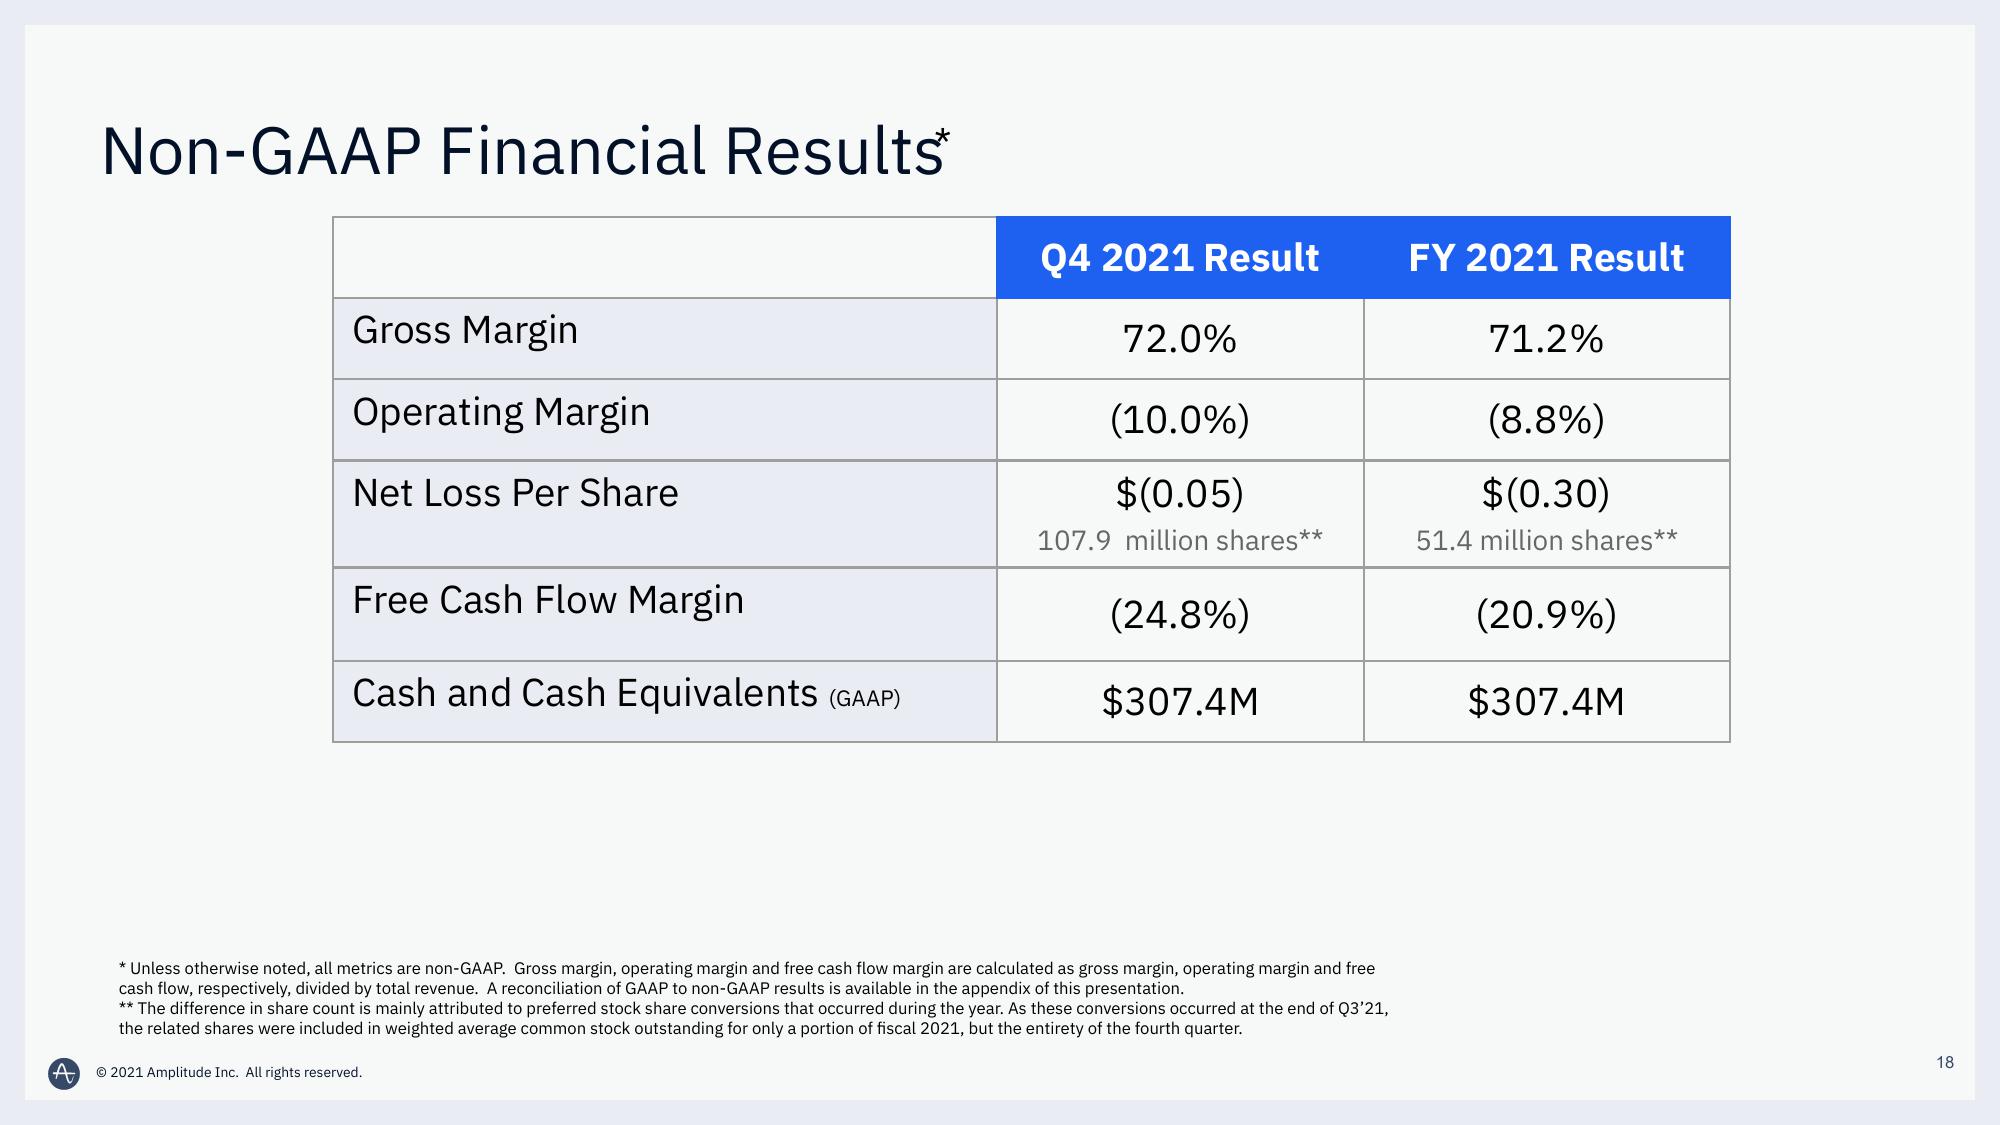
Non-GAAP Financial Results
Gross Margin
Operating Margin
Net Loss Per Share
Free Cash Flow Margin
Cash and Cash Equivalents (GAAP)
Q4 2021 Result
72.0%
(10.0%)
$(0.05)
107.9 million shares**
© 2021 Amplitude Inc. All rights reserved.
(24.8%)
$307.4M
* Unless otherwise noted, all metrics are non-GAAP. Gross margin, operating margin and free cash flow margin are calculated as gross margin, operating margin and free
cash flow, respectively, divided by total revenue. A reconciliation of GAAP to non-GAAP results is available in the appendix of this presentation.
** The difference in share count is mainly attributed to preferred stock share conversions that occurred during the year. As these conversions occurred at the end of Q3'21,
the related shares were included in weighted average common stock outstanding for only a portion of fiscal 2021, but the entirety of the fourth quarter.
FY 2021 Result
71.2%
(8.8%)
$(0.30)
51.4 million shares**
(20.9%)
$307.4M
18View entire presentation