Baird Investment Banking Pitch Book
COMPARATIVE COMPANY ANALYSIS
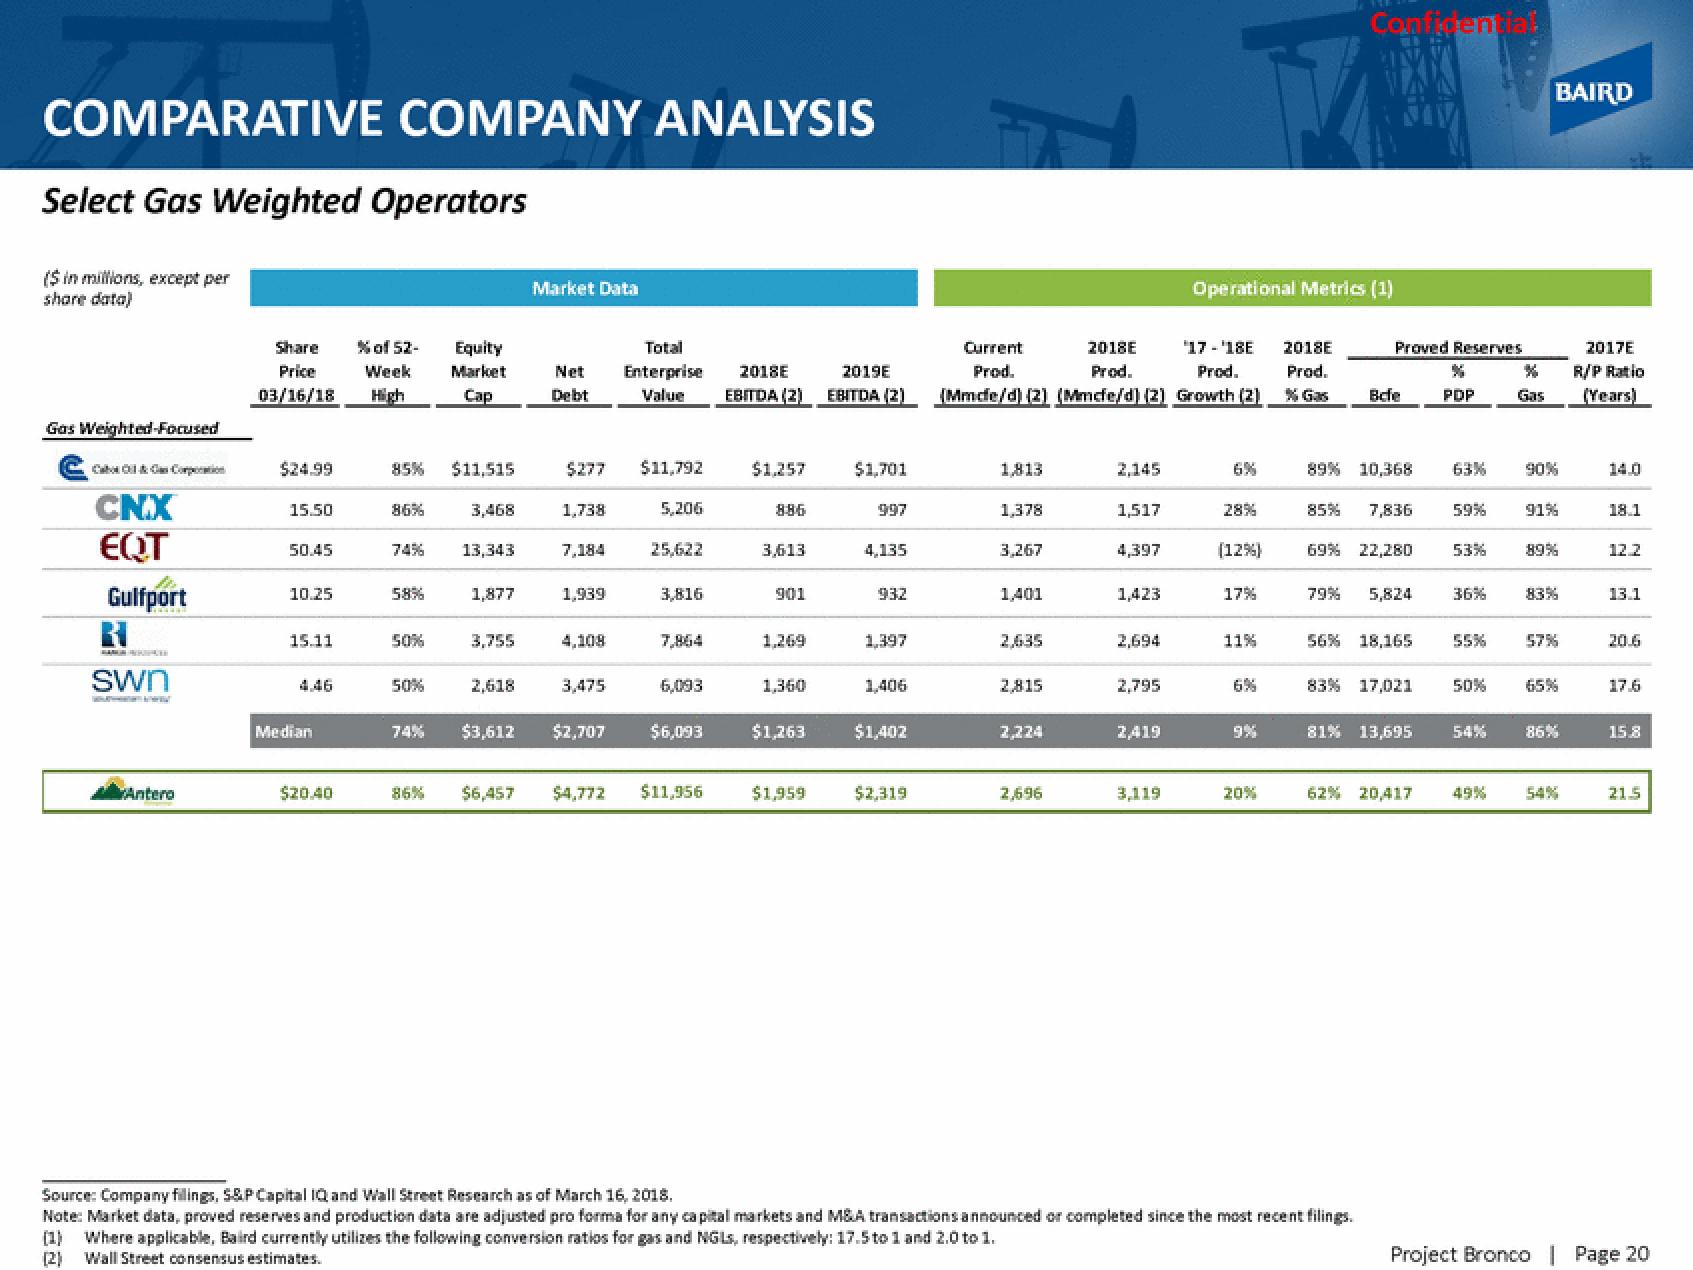
Select Gas Weighted Operators
($ in millions, except per
share data)
Gas Weighted-Focused
C&C Corporation
CNX
EQT
Gulfport
RI
Swn
Antero
Share % of 52-
Price Week
03/16/18 High
$24.99
15.50
50.45
10.25
15.11
Median
$20.40
85% $11,515
86%
58%
50%
Equity
Market
Cap
50%
3,468
13,343
1,877
3,755
2,618
Market Data
Net
Debt
$277 $11,792
5,206
1,738
7,184
1,939
4,108
Total
Enterprise
2018E
2019E
Value EBITDA (2) EBITDA (2)
3,475
25,622
3,816
6,093
74% $3,612 $2,707 $6,093
86% $6,457 $4,772 $11,956
$1,257
886
3,613
901
1,269
1,360
$1,263
$1,959
$1,701
997
4.135
932
1,397
1,406
$1,402
$2,319
Current
2018E '17-'18E 2018E
Prod.
Prod.
Prod. Prod.
(Mmde/d) (2) (Mmde/d) (2) Growth (2)
% Gas
1,813
1,378
3,267
1401
2,635
2,815
2,224
2,696
2,145
1,517
4,397
1,423
2,694
2,795
2,419
3,119
Operational Metrics (1)
28%
(12%)
17%
11%
20%
Confidential
Proved Reserves
Bcfe
89% 10,368
85% 7,836
69% 22,280
79% 5,824
56% 18,165
83% 17,021
Source: Company filings, S&P Capital IQ and Wall Street Research as of March 16, 2018.
Note: Market data, proved reserves and production data are adjusted pro forma for any capital markets and M&A transactions announced or completed since the most recent filings.
(1) Where applicable, Baird currently utilizes the following conversion ratios for gas and NGLs, respectively: 17.5 to 1 and 2.0 to 1.
(2)
Wall Street consensus estimates.
81% 13,695
62% 20,417
PDP
63%
59%
53%
55%
50%
54%
49%
Gas
BAIRD
90%
91%
89%
57%
65%
86%
2017E
R/P Ratio
(Years)
18.1
12.2
13.1
20.6
17.6
15.8
21.5
Project Bronco | Page 20View entire presentation