Maersk Results Presentation Deck
Maersk Group
- Interim Report 03 2015
MAERSK LINE
Contents
The quarter was characterised by poor market conditions with
oversupply and decreased imports into Europe, where freight
rates declined to new historical lows.
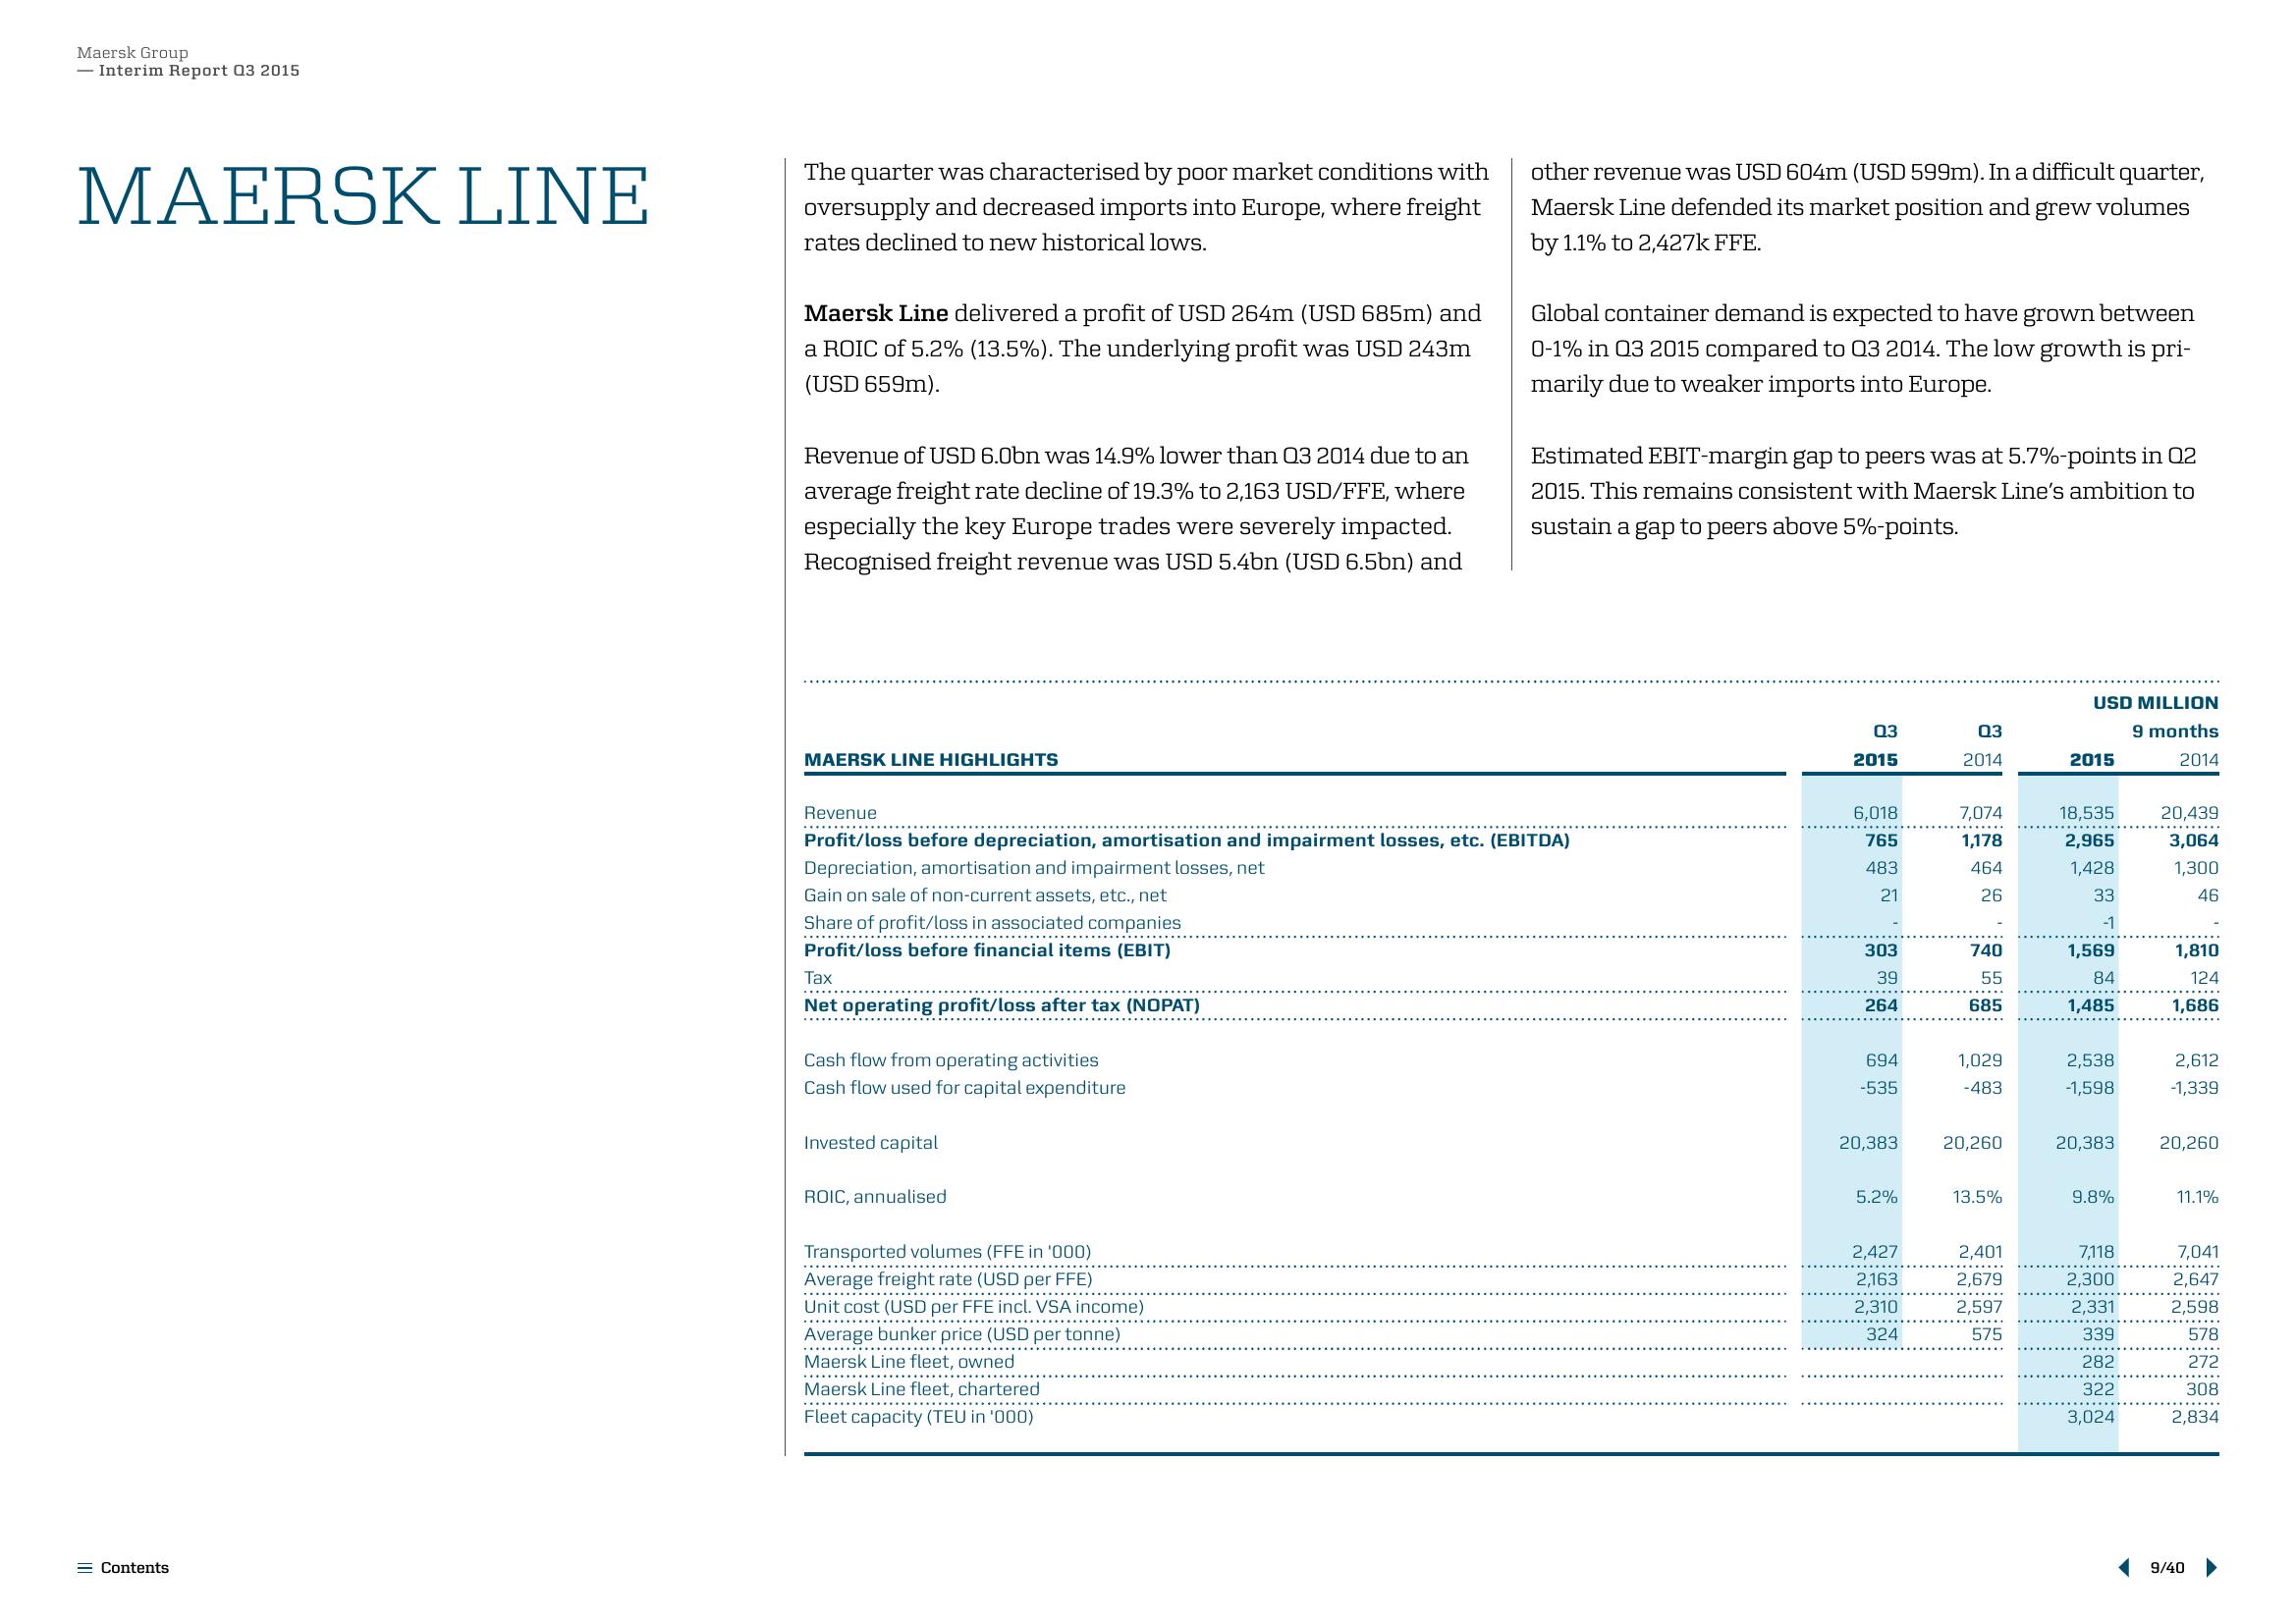
Maersk Line delivered a profit of USD 264m (USD 685m) and
a ROIC of 5.2% (13.5%). The underlying profit was USD 243m
(USD 659m).
Revenue of USD 6.0bn was 14.9% lower than 03 2014 due to an
average freight rate decline of 19.3% to 2,163 USD/FFE, where
especially the key Europe trades were severely impacted.
Recognised freight revenue was USD 5.4bn (USD 6.5bn) and
MAERSK LINE HIGHLIGHTS
Tax
Net operating profit/loss after tax (NOPAT)
Cash flow from operating activities
Cash flow used for capital expenditure
Revenue
Profit/loss before depreciation, amortisation and impairment losses, etc. (EBITDA)
Depreciation, amortisation and impairment losses, net
Gain on sale of non-current assets, etc., net
Share of profit/loss in associated companies
Profit/loss before financial items (EBIT)
Invested capital
ROIC, annualised
other revenue was USD 604m (USD 599m). In a difficult quarter,
Maersk Line defended its market position and grew volumes
by 1.1% to 2,427k FFE.
Transported volumes (FFE in '000)
Average freight rate (USD per FFE)
Unit cost (USD per FFE incl. VSA income)
Average bunker price (USD per tonne)
Maersk Line fleet, owned
Maersk Line fleet, chartered
Fleet capacity (TEU in '000)
Global container demand is expected to have grown between
0-1% in Q3 2015 compared to Q3 2014. The low growth is pri-
marily due to weaker imports into Europe.
Estimated EBIT-margin gap to peers was at 5.7%-points in 02
2015. This remains consistent with Maersk Line's ambition to
sustain a gap to peers above 5%-points.
03
2015
6,018
765
483
21
303
39
264
694
-535
20,383
5.2%
2,427
2,163
2,310
324
03
2014
7,074
1,178
464
26
740
55
685
1,029
-483
20,260
13.5%
2,401
2,679
2,597
575
USD MILLION
9 months
2014
2015
18,535
2,965
1,428
33
-1
1,569
84
1,485
2,538
-1,598
20,383
9.8%
7,118
2,300
2,331
339
282
322
3,024
20,439
3,064
1,300
46
1,810
124
1,686
2,612
-1,339
20,260
11.1%
7,041
2,647
2,598
578
272
308
2,834
9/40View entire presentation