Bird SPAC Presentation Deck
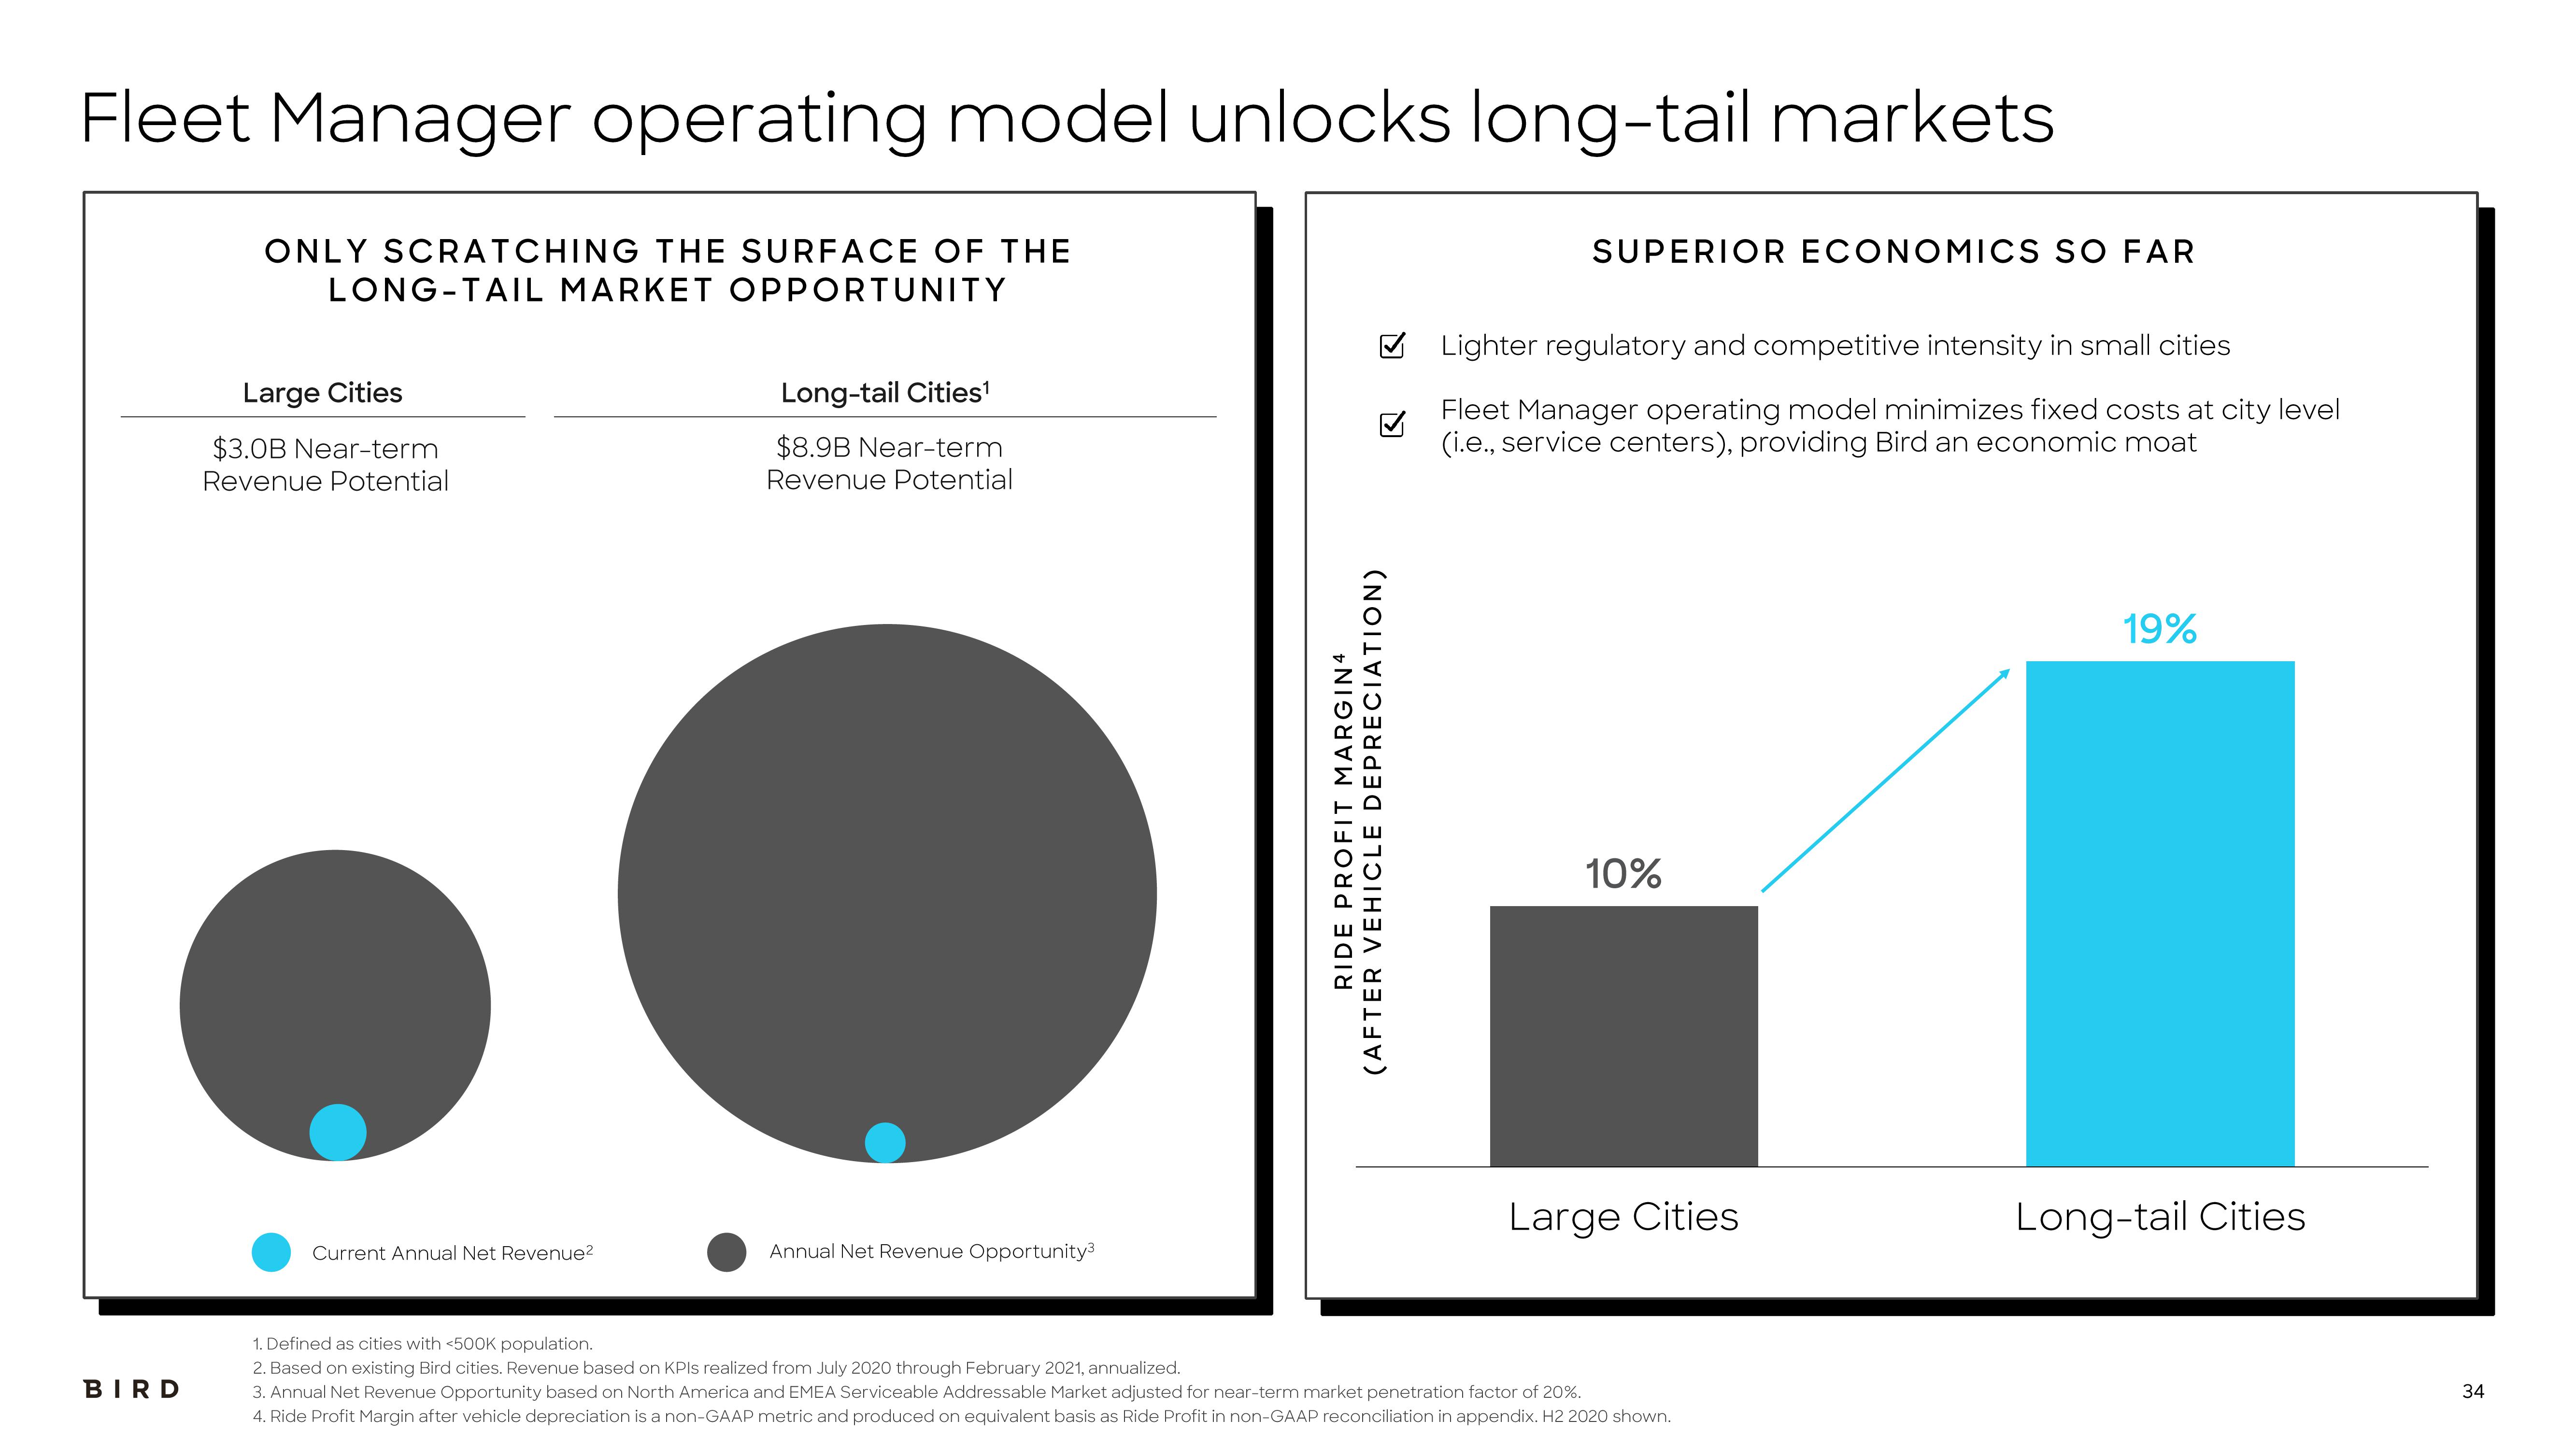
Fleet Manager operating model unlocks long-tail markets
BIRD
ONLY SCRATCHING THE SURFACE OF THE
LONG-TAIL MARKET OPPORTUNITY
Large Cities
$3.0B Near-term
Revenue Potential
Current Annual Net Revenue²
Long-tail Cities¹
$8.9B Near-term
Revenue Potential
Annual Net Revenue Opportunity³
DEPRECIATION)
RIDE PROFIT MARGIN4
(AFTER VEHICLE
SUPERIOR ECONOMICS SO FAR
Lighter regulatory and competitive intensity in small cities
Fleet Manager operating model minimizes fixed costs at city level
(i.e., service centers), providing Bird an economic moat
10%
Large Cities
1. Defined as cities with <500K population.
2. Based on existing Bird cities. Revenue based on KPIs realized from July 2020 through February 2021, annualized.
3. Annual Net Revenue Opportunity based on North America and EMEA Serviceable Addressable Market adjusted for near-term market penetration factor of 20%.
4. Ride Profit Margin after vehicle depreciation is a non-GAAP metric and produced on equivalent basis as Ride Profit in non-GAAP reconciliation in appendix. H2 2020 shown.
19%
Long-tail Cities
34View entire presentation