Shoals Results Presentation Deck
REDUCING INSTALLATION COST IS CRITICAL
FOR CONTINUED COST REDUCTION IN SOLAR
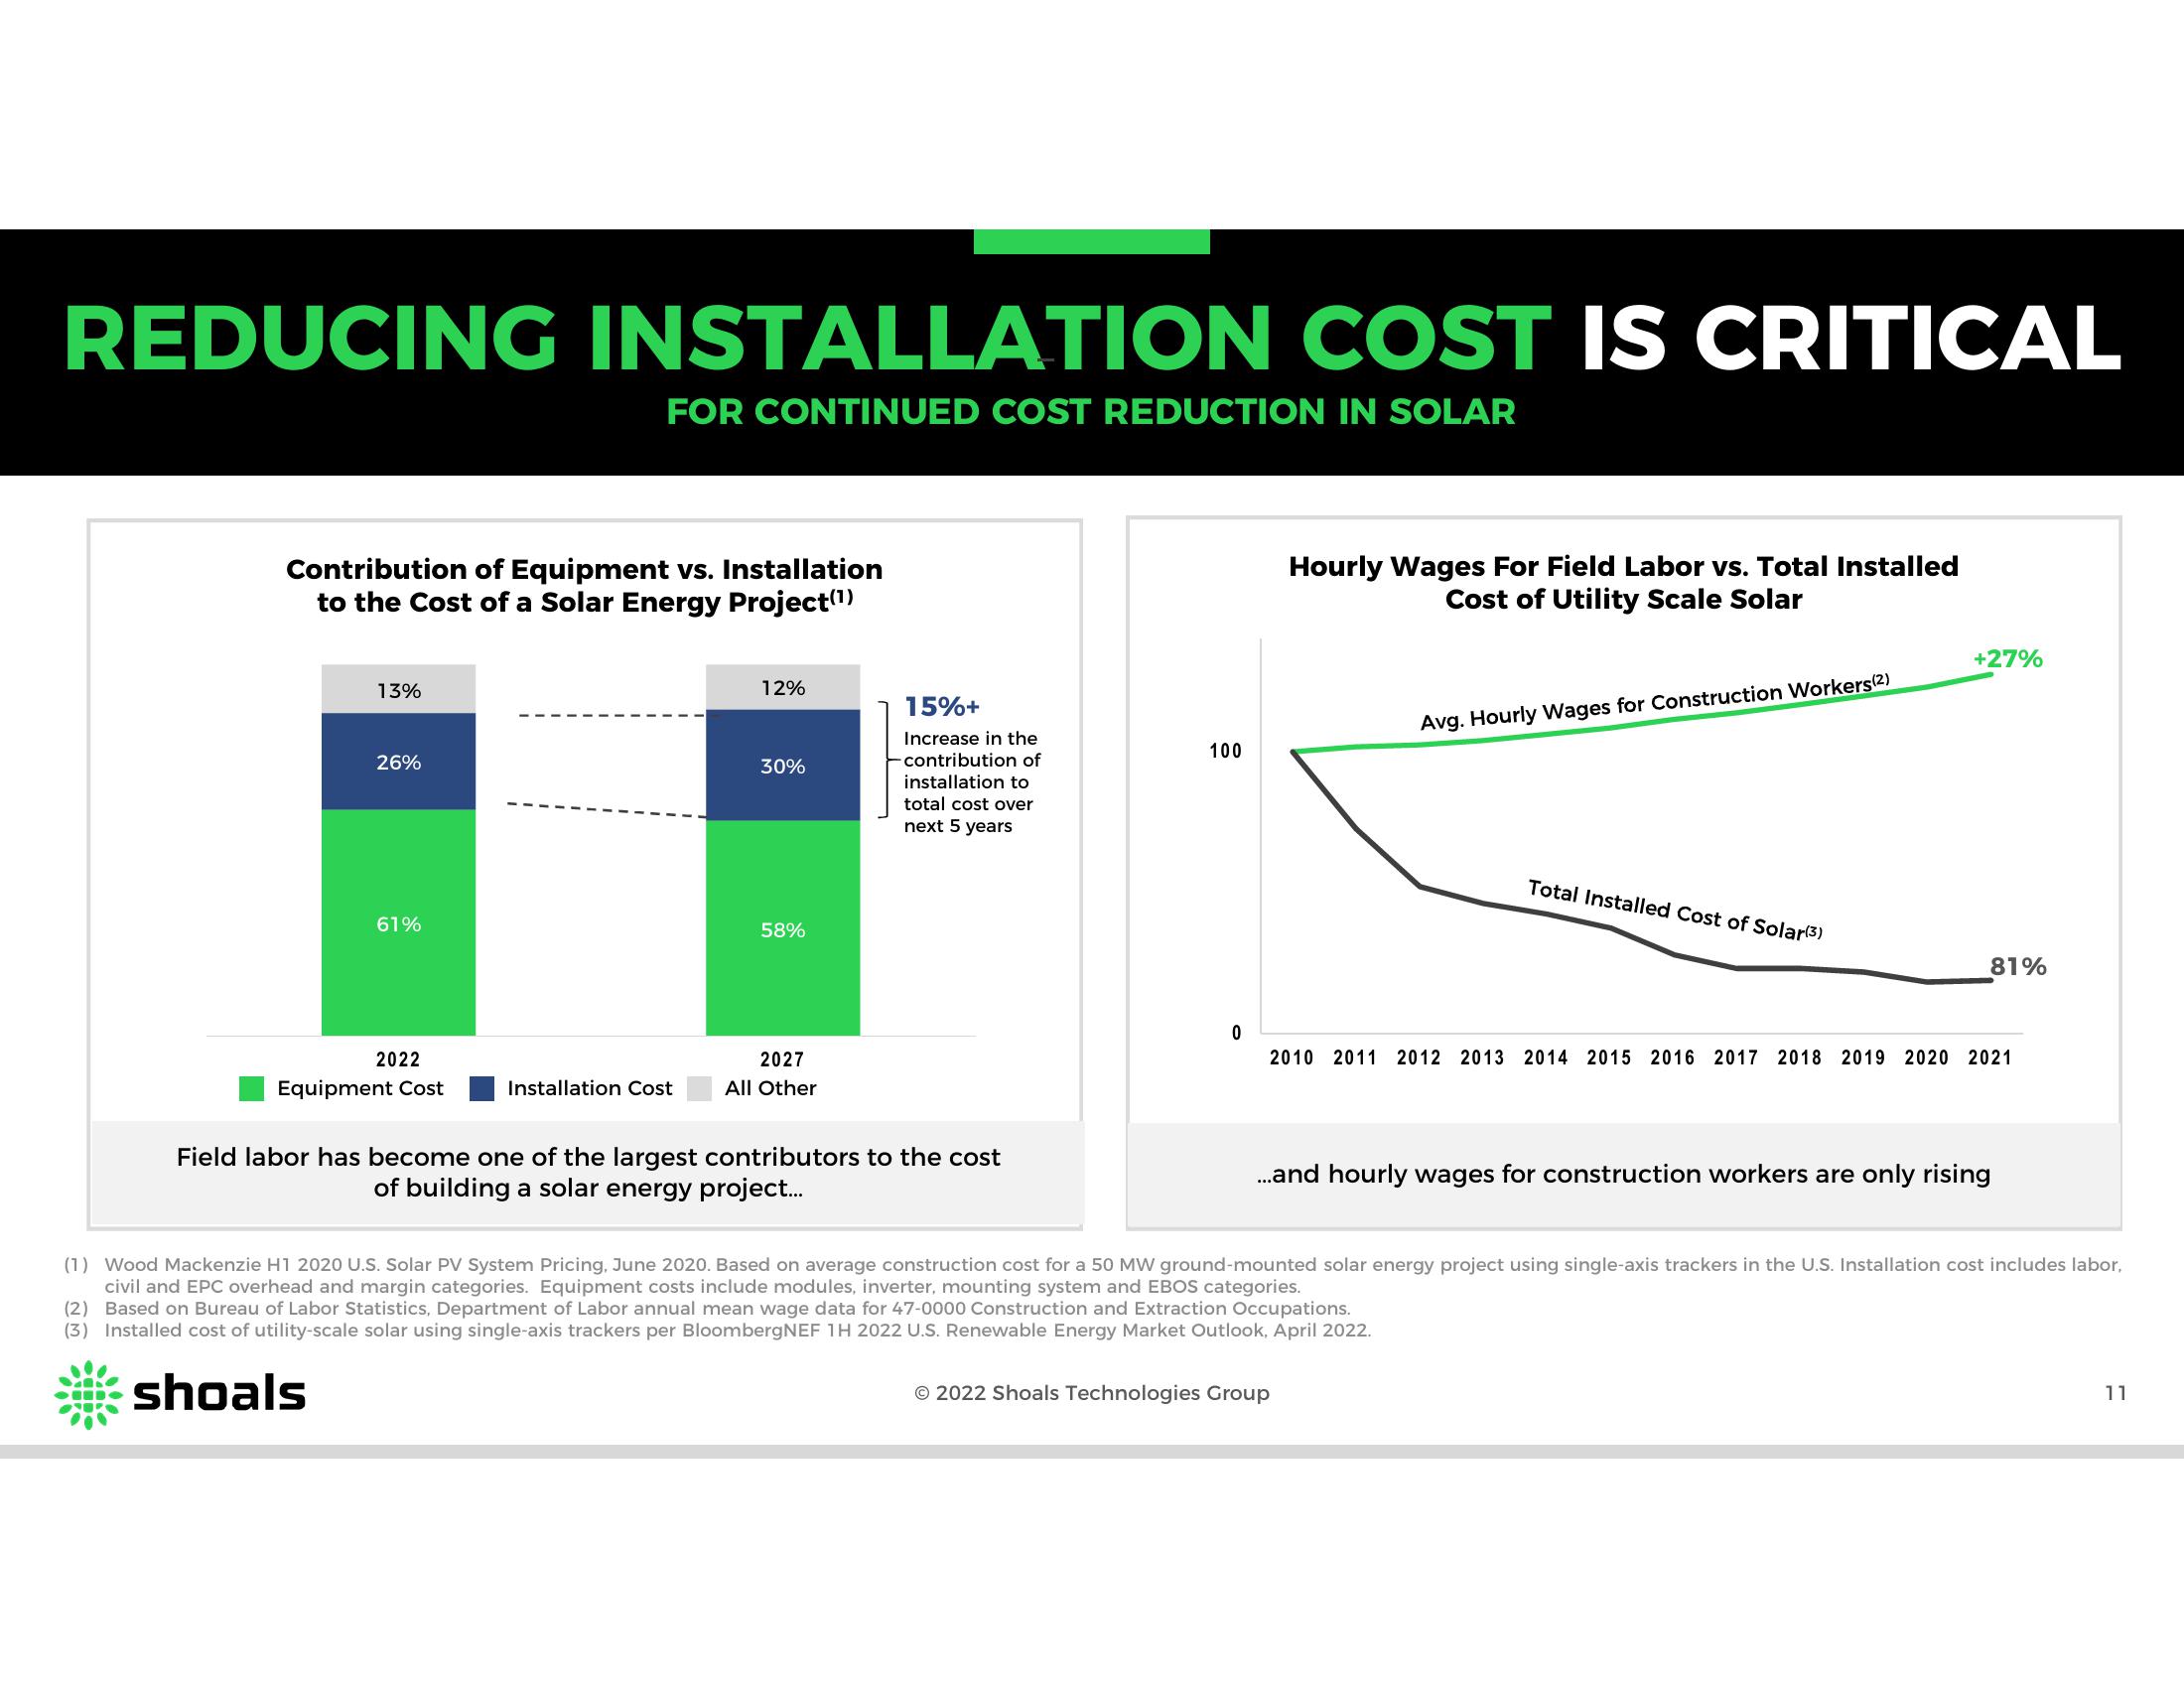
Contribution of Equipment vs. Installation
to the Cost of a Solar Energy Project(¹)
13%
26%
61%
2022
Equipment Cost
Installation Cost
12%
30%
58%
2027
All Other
15%+
Increase in the
contribution of
installation to
total cost over
next 5 years
Field labor has become one of the largest contributors to the cost
of building a solar energy project...
100
0
Hourly Wages For Field Labor vs. Total Installed
Cost of Utility Scale Solar
Avg. Hourly Wages for Construction Workers(2)
Total Installed Cost of Solar(3)
© 2022 Shoals Technologies Group
+27%
81%
2010 2011 2012 2013 2014 2015 2016 2017 2018 2019 2020 2021
...and hourly wages for construction workers are only rising
(1) Wood Mackenzie H1 2020 U.S. Solar PV System Pricing, June 2020. Based on average construction cost for a 50 MW ground-mounted solar energy project using single-axis trackers in the U.S. Installation cost includes labor,
civil and EPC overhead and margin categories. Equipment costs include modules, inverter, mounting system and EBOS categories.
(2) Based on Bureau of Labor Statistics, Department of Labor annual mean wage data for 47-0000 Construction and Extraction Occupations.
(3) Installed cost of utility-scale solar using single-axis trackers per BloombergNEF 1H 2022 U.S. Renewable Energy Market Outlook, April 2022.
shoals
11View entire presentation