PJT Partners Investment Banking Pitch Book
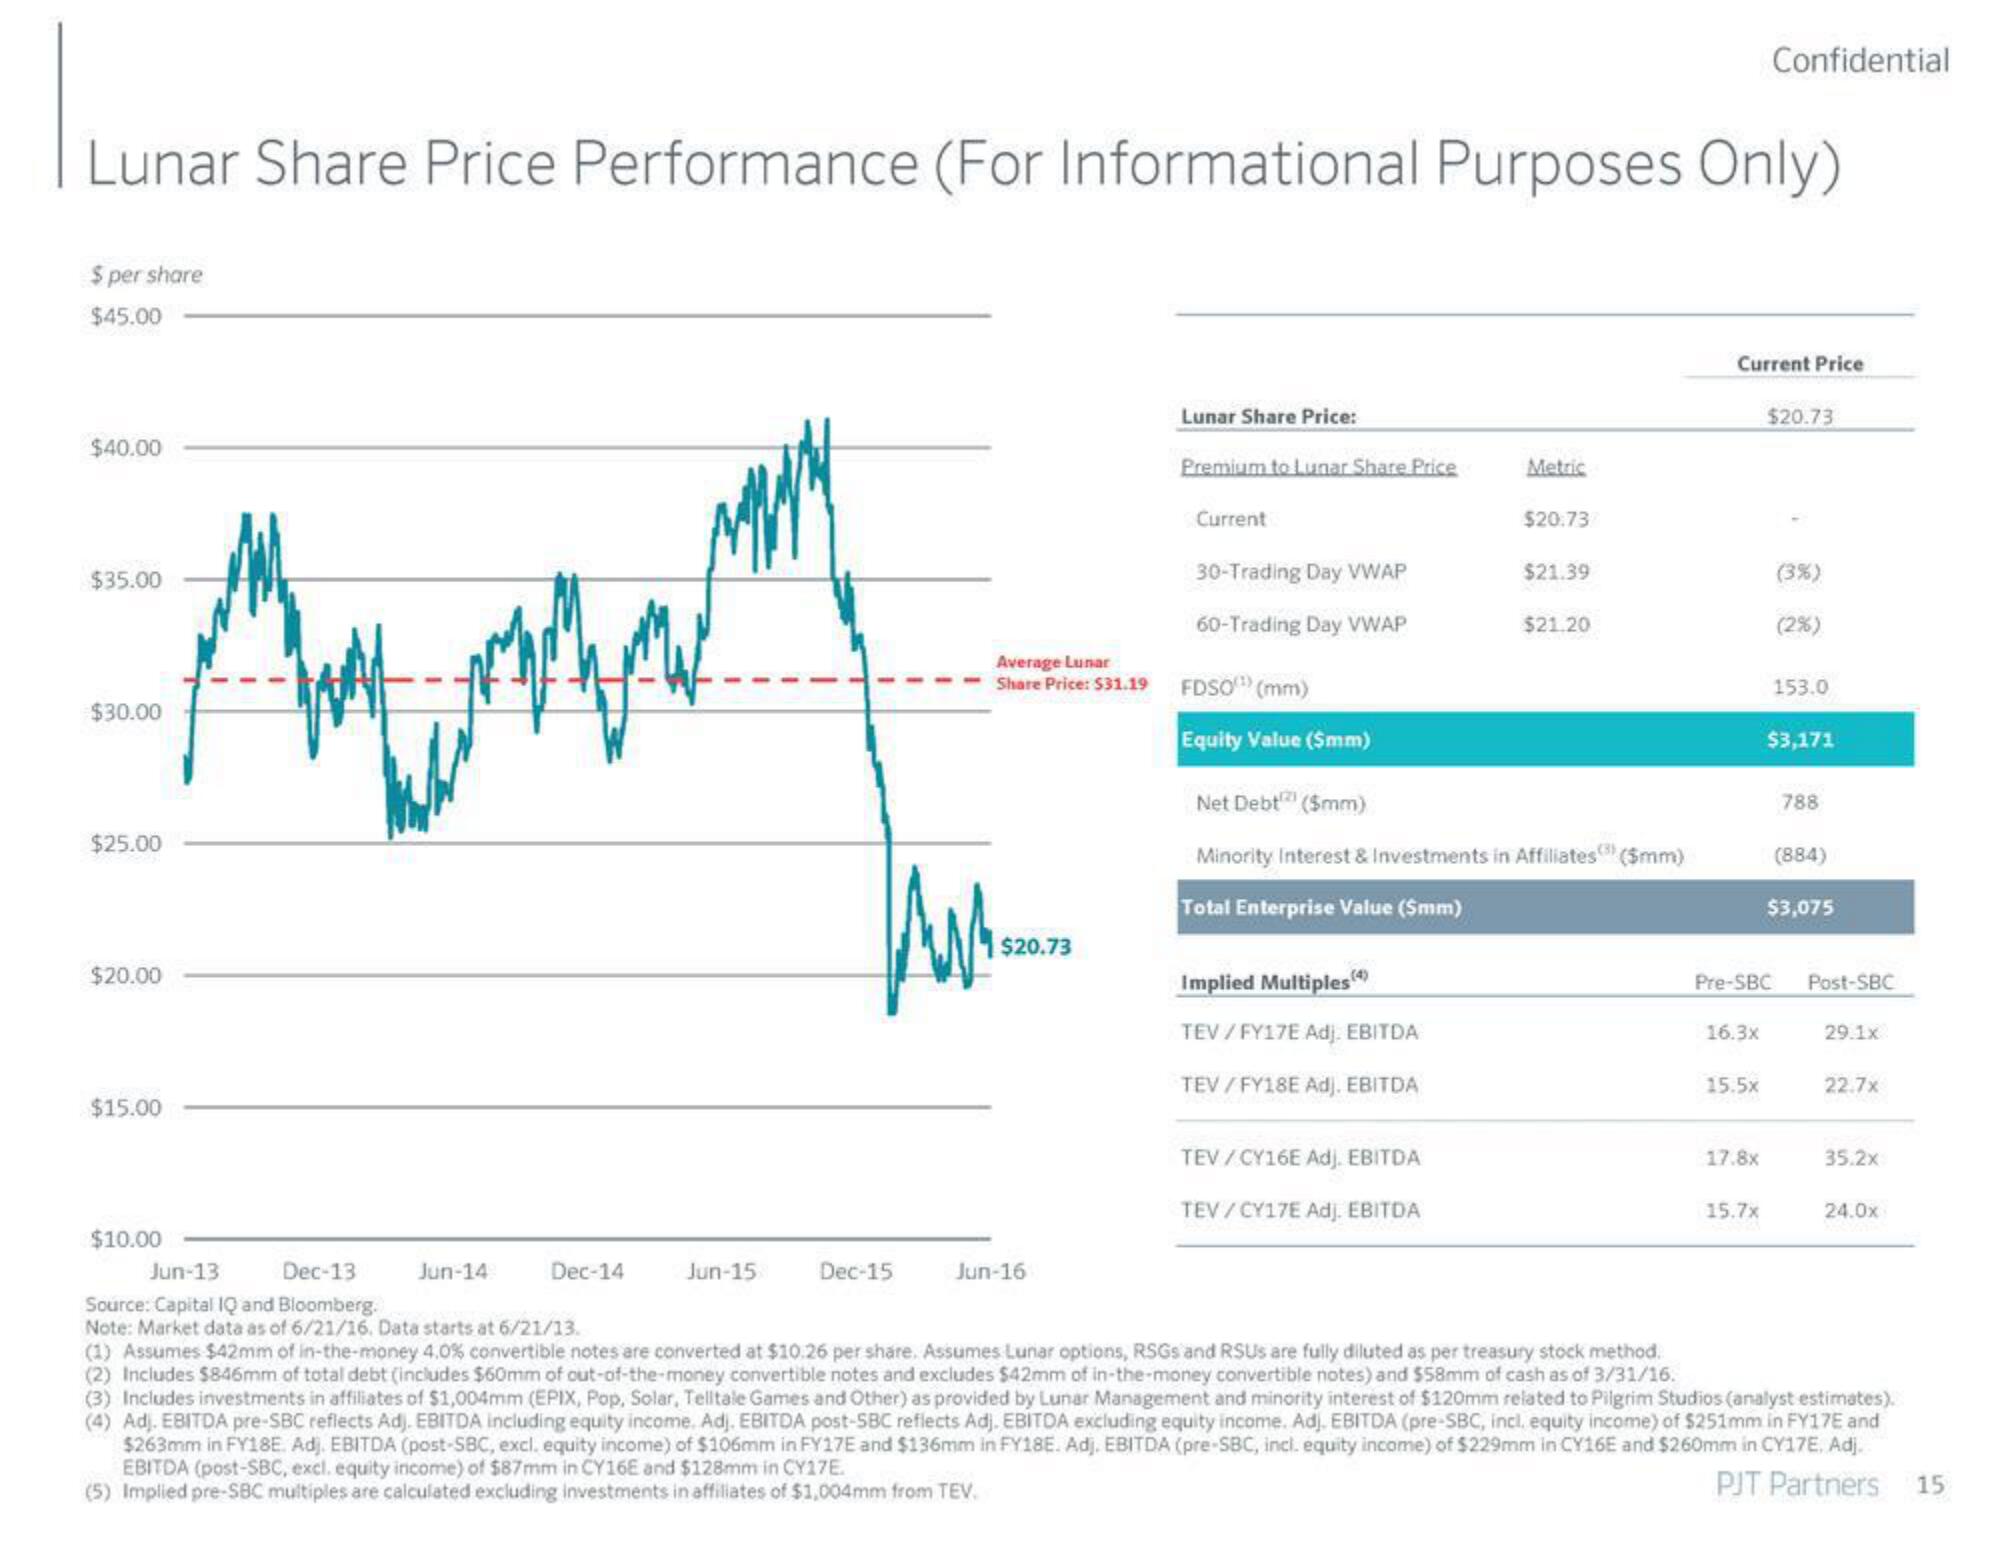
Lunar Share Price Performance (For Informational Purposes Only)
$ per share
$45.00
$40.00
$35.00
$30.00
$25.00
$20.00
$15.00
$10.00
Jun-13
Dec-13
Source: Capital IQ and Bloomberg.
Note: Market data as of 6/21/16. Data starts at 6/21/13.
Jun-14
Dec-14
Jun-15
Dec-15
$20.73
Lunar Share Price:
Premium to Lunar Share Price
Jun-16
Current
Average Lunar
Share Price: $31.19 FDSO) (mm)
30-Trading Day VWAP
60-Trading Day VWAP
Equity Value ($mm)
Implied Multiples)
TEV / FY17E Adj. EBITDA
TEV/FY18E Adj. EBITDA
Metric
TEV/CY16E Adj. EBITDA
TEV/CY17E Adj. EBITDA
$20.73
$21.39
Net Debt (5mm)
Minority Interest & Investments in Affiliates (5mm)
Total Enterprise Value (5mm)
$21.20
Current Price
16.3x
Confidential
15.5x
17.8x
15.7x
$20.73
Pre-SBC
(3%)
(2%)
153.0
$3,171
788
(884)
$3,075
Post-SBC
29.1x
22.7x
35.2x
24.0x
(1) Assumes $42mm of in-the-money 4.0% convertible notes are converted at $10.26 per share. Assumes Lunar options, RSGs and RSUs are fully diluted as per treasury stock method.
(2) Includes $846mm of total debt (includes $60mm of out-of-the-money convertible notes and excludes $42mm of in-the-money convertible notes) and $58mm of cash as of 3/31/16.
(3) Includes investments in affiliates of $1,004mm (EPIX, Pop, Solar, Telltale Games and Other) as provided by Lunar Management and minority interest of $120mm related to Pilgrim Studios (analyst estimates).
(4) Adj. EBITDA pre-SBC reflects Ad). EBITDA including equity income. Adj. EBITDA post-SBC reflects Adj. EBITDA excluding equity income. Adj. EBITDA (pre-SBC, incl. equity income) of $251mm in FY17E and
$263mm in FY18E. Adj. EBITDA (post-SBC, excl. equity income) of $106mm in FY17E and $136mm in FY18E. Adj. EBITDA (pre-SBC, incl. equity income) of $229mm in CY16E and $260mm in CY17E, Adj.
EBITDA (post-SBC, excl. equity income) of $87mm in CY16E and $128mm in CY17E.
(5) Implied pre-SBC multiples are calculated excluding investments in affiliates of $1,004mm from TEV.
PJT Partners
15View entire presentation