Evercore Investment Banking Pitch Book
Discussion Materials
Preliminary Draft - Confidential
Illustrative Sharing of Synergies
($ in millions, except per share amounts)
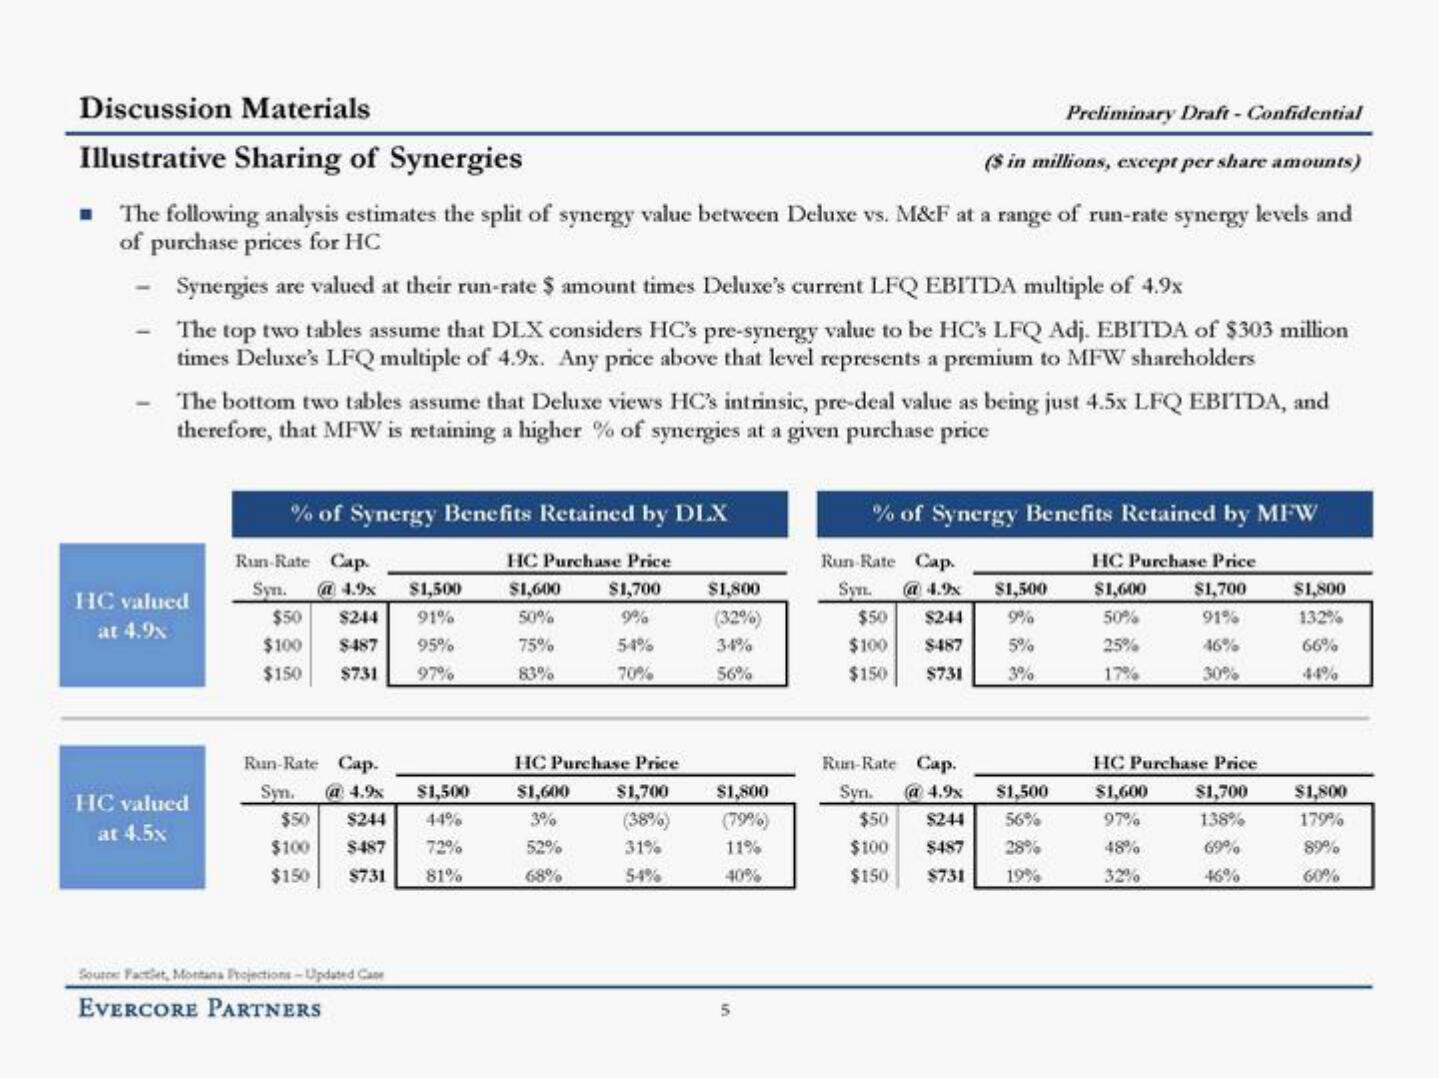
■ The following analysis estimates the split of synergy value between Deluxe vs. M&F at a range of run-rate synergy levels and
of purchase prices for HC
Synergies are valued at their run-rate $ amount times Deluxe's current LFQ EBITDA multiple of 4.9x
The top two tables assume that DLX considers HC's pre-synergy value to be HC's LFQ Adj. EBITDA of $303 million
times Deluxe's LFQ multiple of 4.9x. Any price above that level represents a premium to MFW shareholders
The bottom two tables assume that Deluxe views HC's intrinsic, pre-deal value as being just 4.5x LFQ EBITDA, and
therefore, that MFW is retaining a higher % of synergies at a given purchase price
HC valued
at 4.9x
HC valued
at 4.5x
% of Synergy Benefits Retained by DLX
Run-Rate Cap.
Syn. @4.9x $1,500
$50 $244 91%
$100
$487
95%
$150
$731
97%
Run-Rate Cap.
Syn. (4.9%
$1,500
$50 $244 44%
$100 $487
72%
$150
$731
81%
Source Factlet, Montana Projections-Updated Case
EVERCORE PARTNERS
HC Purchase Price
$1,600
$1,700
50%
9%
75%
54%
83%
70%
HC Purchase Price
$1,600
$1,700
3%
(38%)
31%
54%
52%
68%
$1,800
(32%)
34%
56%
$1,800
(79%)
11%
40%
5
% of Synergy Benefits Retained by MFW
Run Rate Cap.
Syn.
$50 $244
$100 $487
$150 $731
Run-Rate Cap.
Syn.
@ 4.9x
$50
$244
$100
$487
$150 $731
$1,500
9%
5%
3%
$1,500
56%
28%
19%
HC Purchase Price
$1,600
$1,700
50%
91%
25%
17%
46%
30%
HC Purchase Price
$1,600
$1,700
97%
138%
48%
69%
46%
$1,800
132%
66%
44%
$1,800
179%
89%
60%View entire presentation