Strategically Positioning Truist Insurance Holdings for Long-Term Success
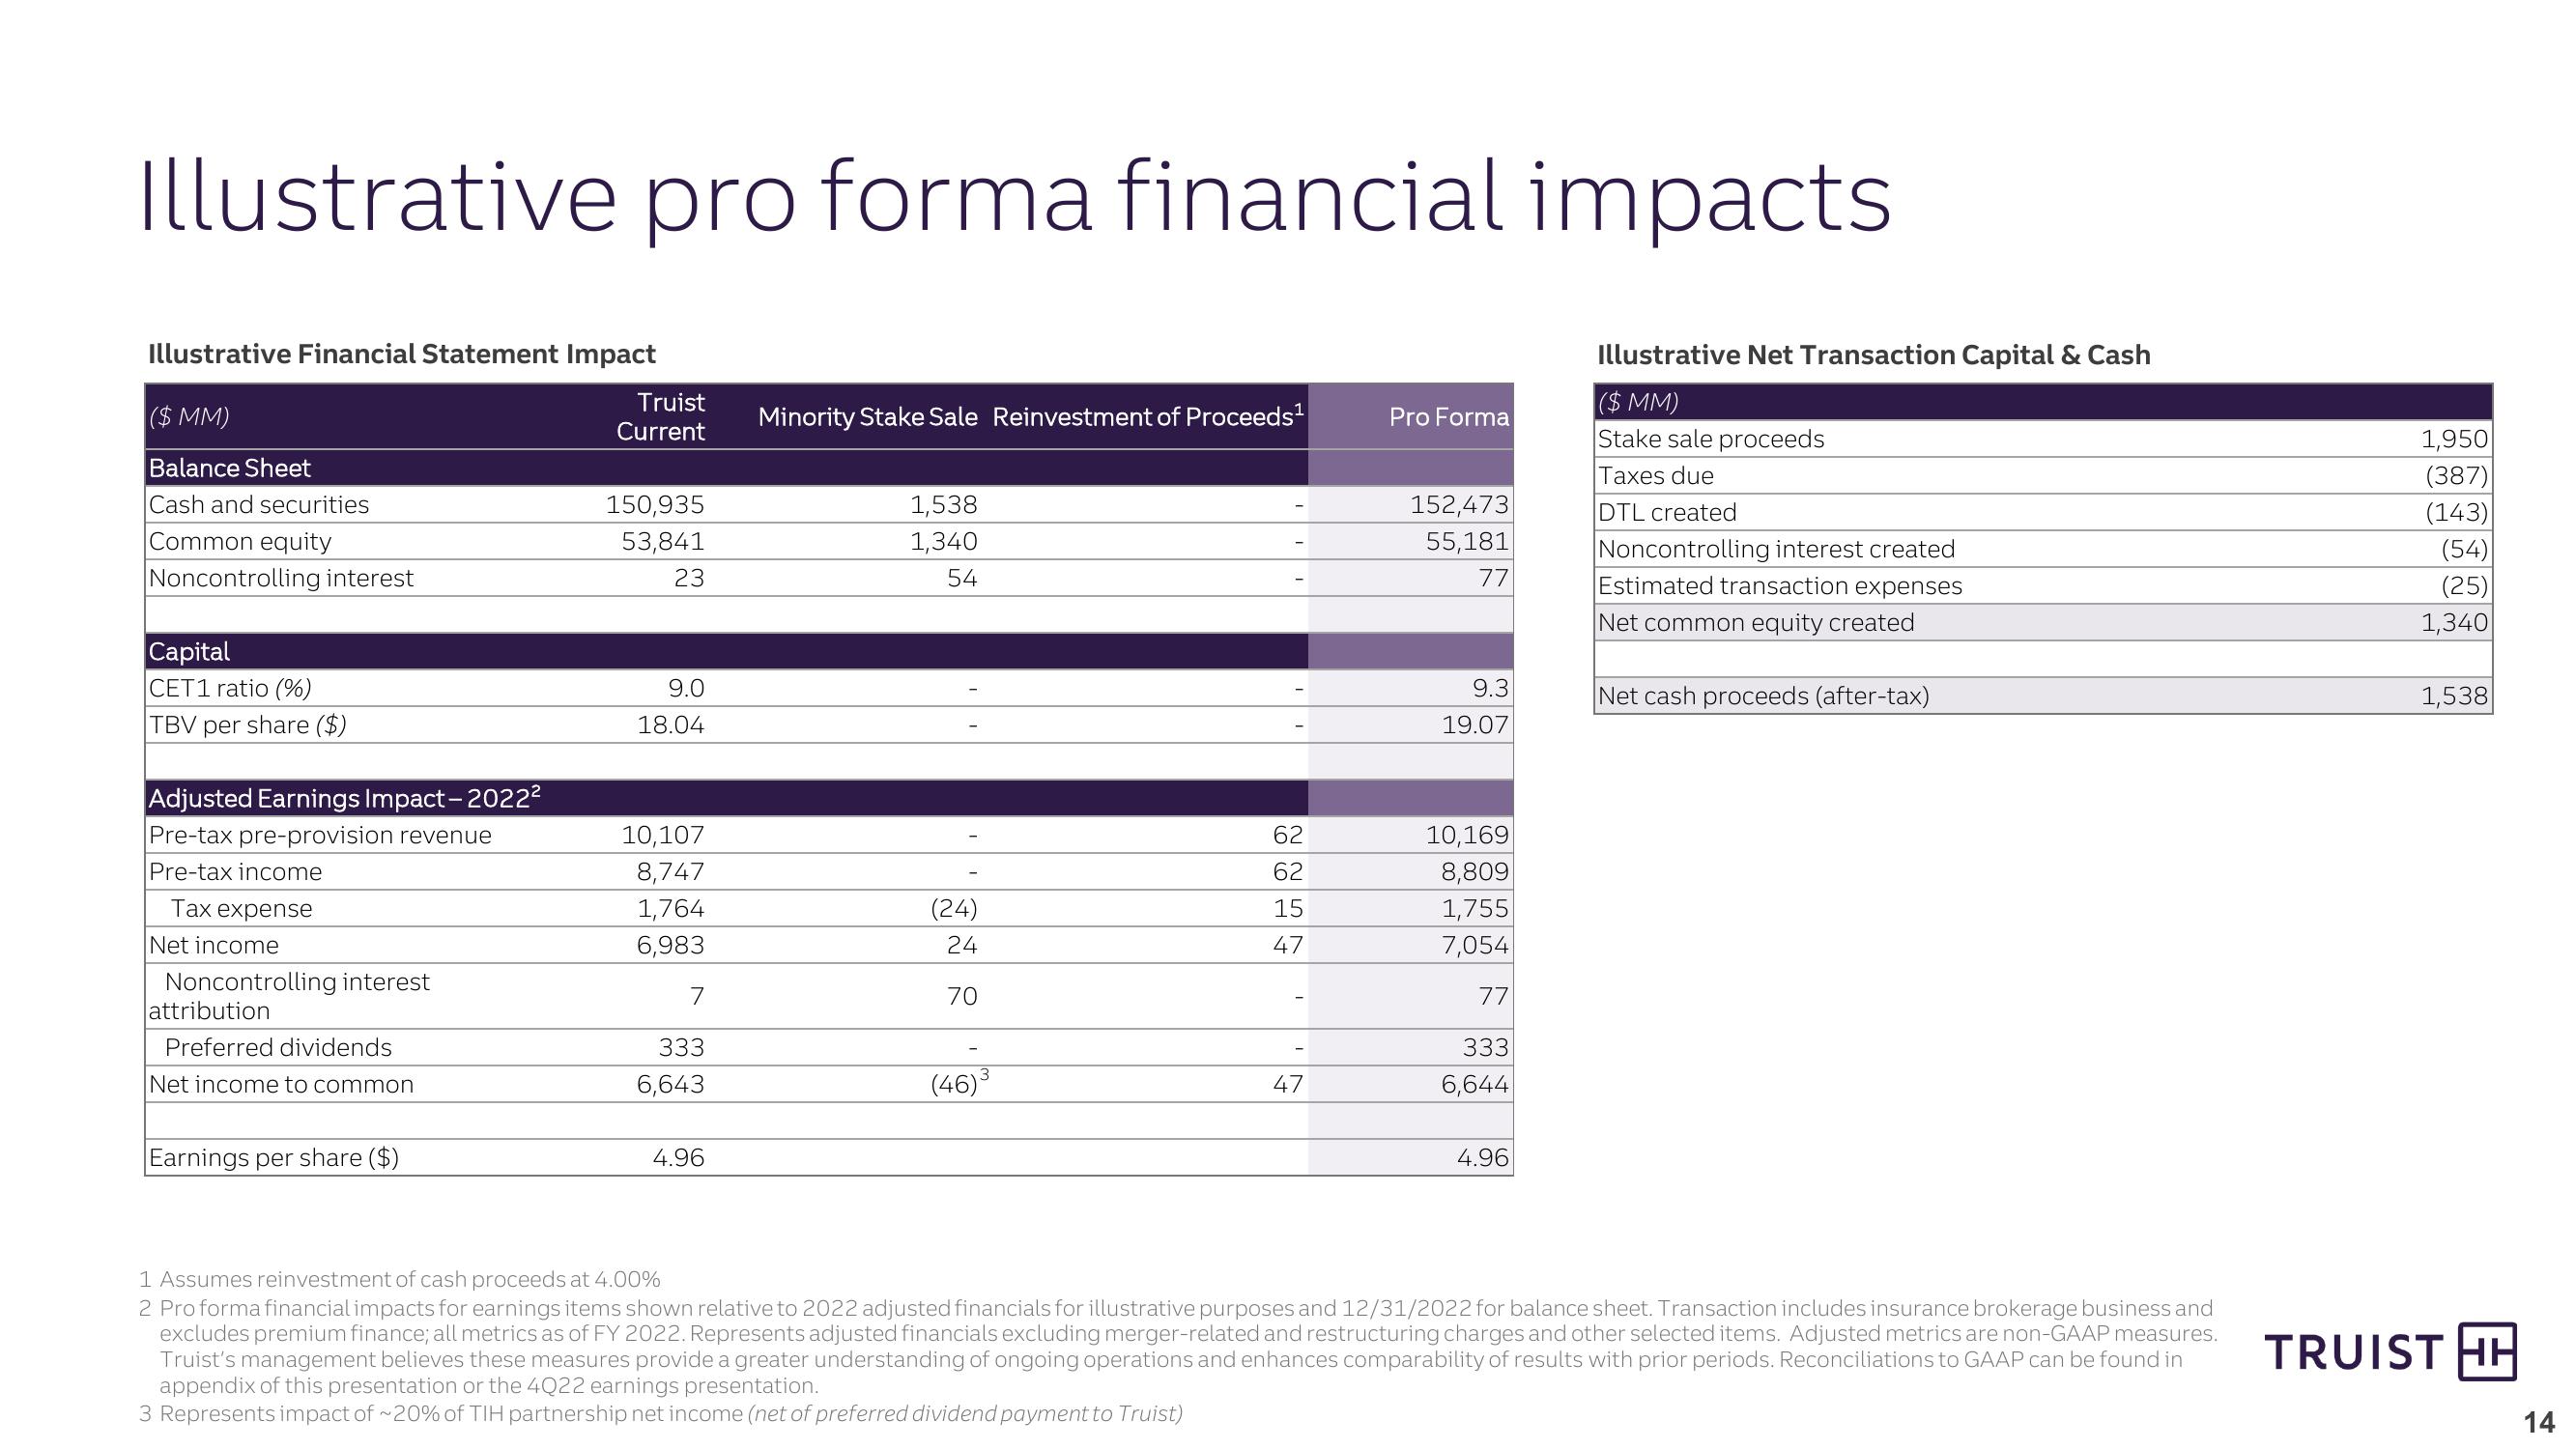
Illustrative pro forma financial impacts.
Cash and securities
150,935
1,538
Common equity
53,841
1,340
Noncontrolling interest
23
54
Illustrative Financial Statement Impact
Illustrative Net Transaction Capital & Cash
Truist
($ MM)
($ MM)
Balance Sheet
Minority Stake Sale Reinvestment of Proceeds¹
Pro Forma
Current
Stake sale proceeds
Taxes due
DTL created
Noncontrolling interest created
Estimated transaction expenses
Net common equity created
152,473
55,181
77
Capital
CET1 ratio (%)
9.0
TBV per share ($)
18.04
9.3
19.07
Net cash proceeds (after-tax)
Adjusted Earnings Impact - 20222
Pre-tax pre-provision revenue
10,107
Pre-tax income
8,747
Tax expense
1,764
(24)
Net income
6,983
24
2247
62
10,169
62
8,809
15
1,755
7,054
Noncontrolling interest
7
70
77
attribution
Preferred dividends
333
333
Net income to common
6,643
(46)³
47
6,644
Earnings per share ($)
4.96
4.96
1 Assumes reinvestment of cash proceeds at 4.00%
2 Pro forma financial impacts for earnings items shown relative to 2022 adjusted financials for illustrative purposes and 12/31/2022 for balance sheet. Transaction includes insurance brokerage business and
excludes premium finance; all metrics as of FY 2022. Represents adjusted financials excluding merger-related and restructuring charges and other selected items. Adjusted metrics are non-GAAP measures.
Truist's management believes these measures provide a greater understanding of ongoing operations and enhances comparability of results with prior periods. Reconciliations to GAAP can be found in
appendix of this presentation or the 4Q22 earnings presentation.
3 Represents impact of ~20% of TIH partnership net income (net of preferred dividend payment to Truist)
1,950
(387)
(143)
(54)
(25)
1,340
1,538
TRUIST HH
14View entire presentation