First Merchants Investor Presentation Deck
Asset Quality
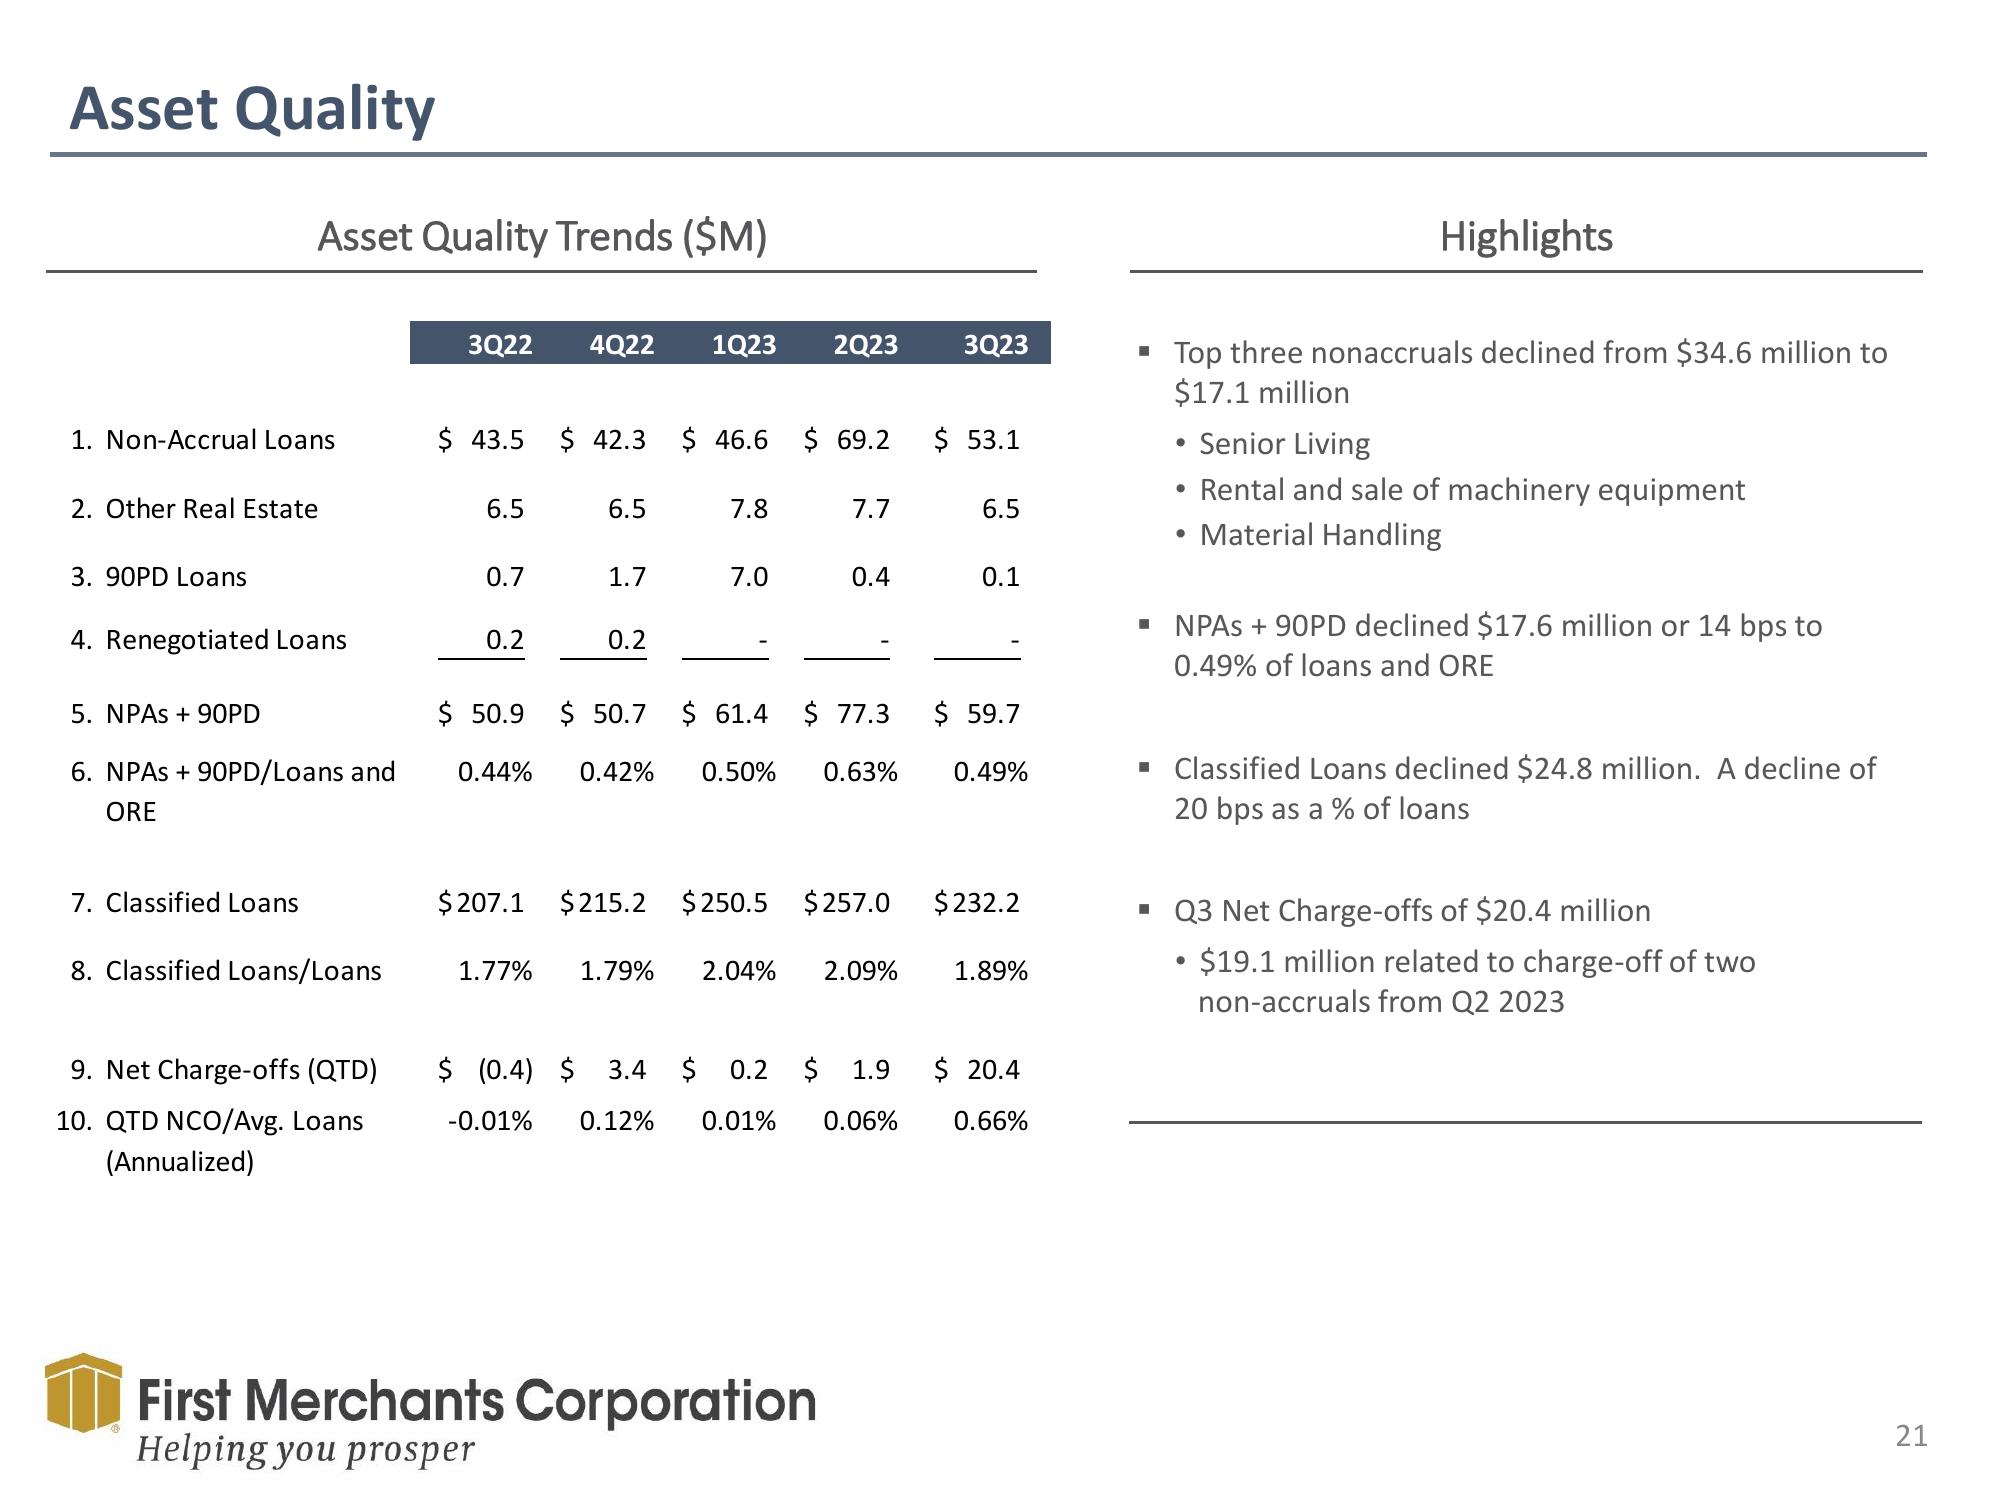
1. Non-Accrual Loans
Asset Quality Trends ($M)
2. Other Real Estate
3. 90PD Loans
4. Renegotiated Loans
5. NPAS + 90PD
6. NPAS + 90PD/Loans and
ORE
7. Classified Loans
8. Classified Loans/Loans
9. Net Charge-offs (QTD)
10. QTD NCO/Avg. Loans
(Annualized)
3Q22
6.5
0.7
4Q22 1Q23
$ 43.5 $ 42.3 $ 46.6 $ 69.2 $ 53.1
0.2
6.5
1.7
0.2
7.8
7.0
2Q23
7.7
0.4
3Q23
First Merchants Corporation
Helping you prosper
1.77% 1.79% 2.04% 2.09%
6.5
$ 50.9 $ 50.7 $ 61.4 $ 77.3 $ 59.7
0.44% 0.42% 0.50% 0.63%
0.1
$207.1 $215.2 $250.5 $257.0 $232.2
0.49%
1.89%
$ (0.4) $ 3.4 $ 0.2 $ 1.9 $ 20.4
-0.01% 0.12% 0.01% 0.06% 0.66%
=
■
M
■
Top three nonaccruals declined from $34.6 million to
$17.1 million
• Senior Living
Rental and sale of machinery equipment
Material Handling
●
Highlights
●
NPAS + 90PD declined $17.6 million or 14 bps to
0.49% of loans and ORE
Classified Loans declined $24.8 million. A decline of
20 bps as a % of loans
Q3 Net Charge-offs of $20.4 million
$19.1 million related to charge-off of two
non-accruals from Q2 2023
●
21View entire presentation