Toyota Investor Presentation Deck
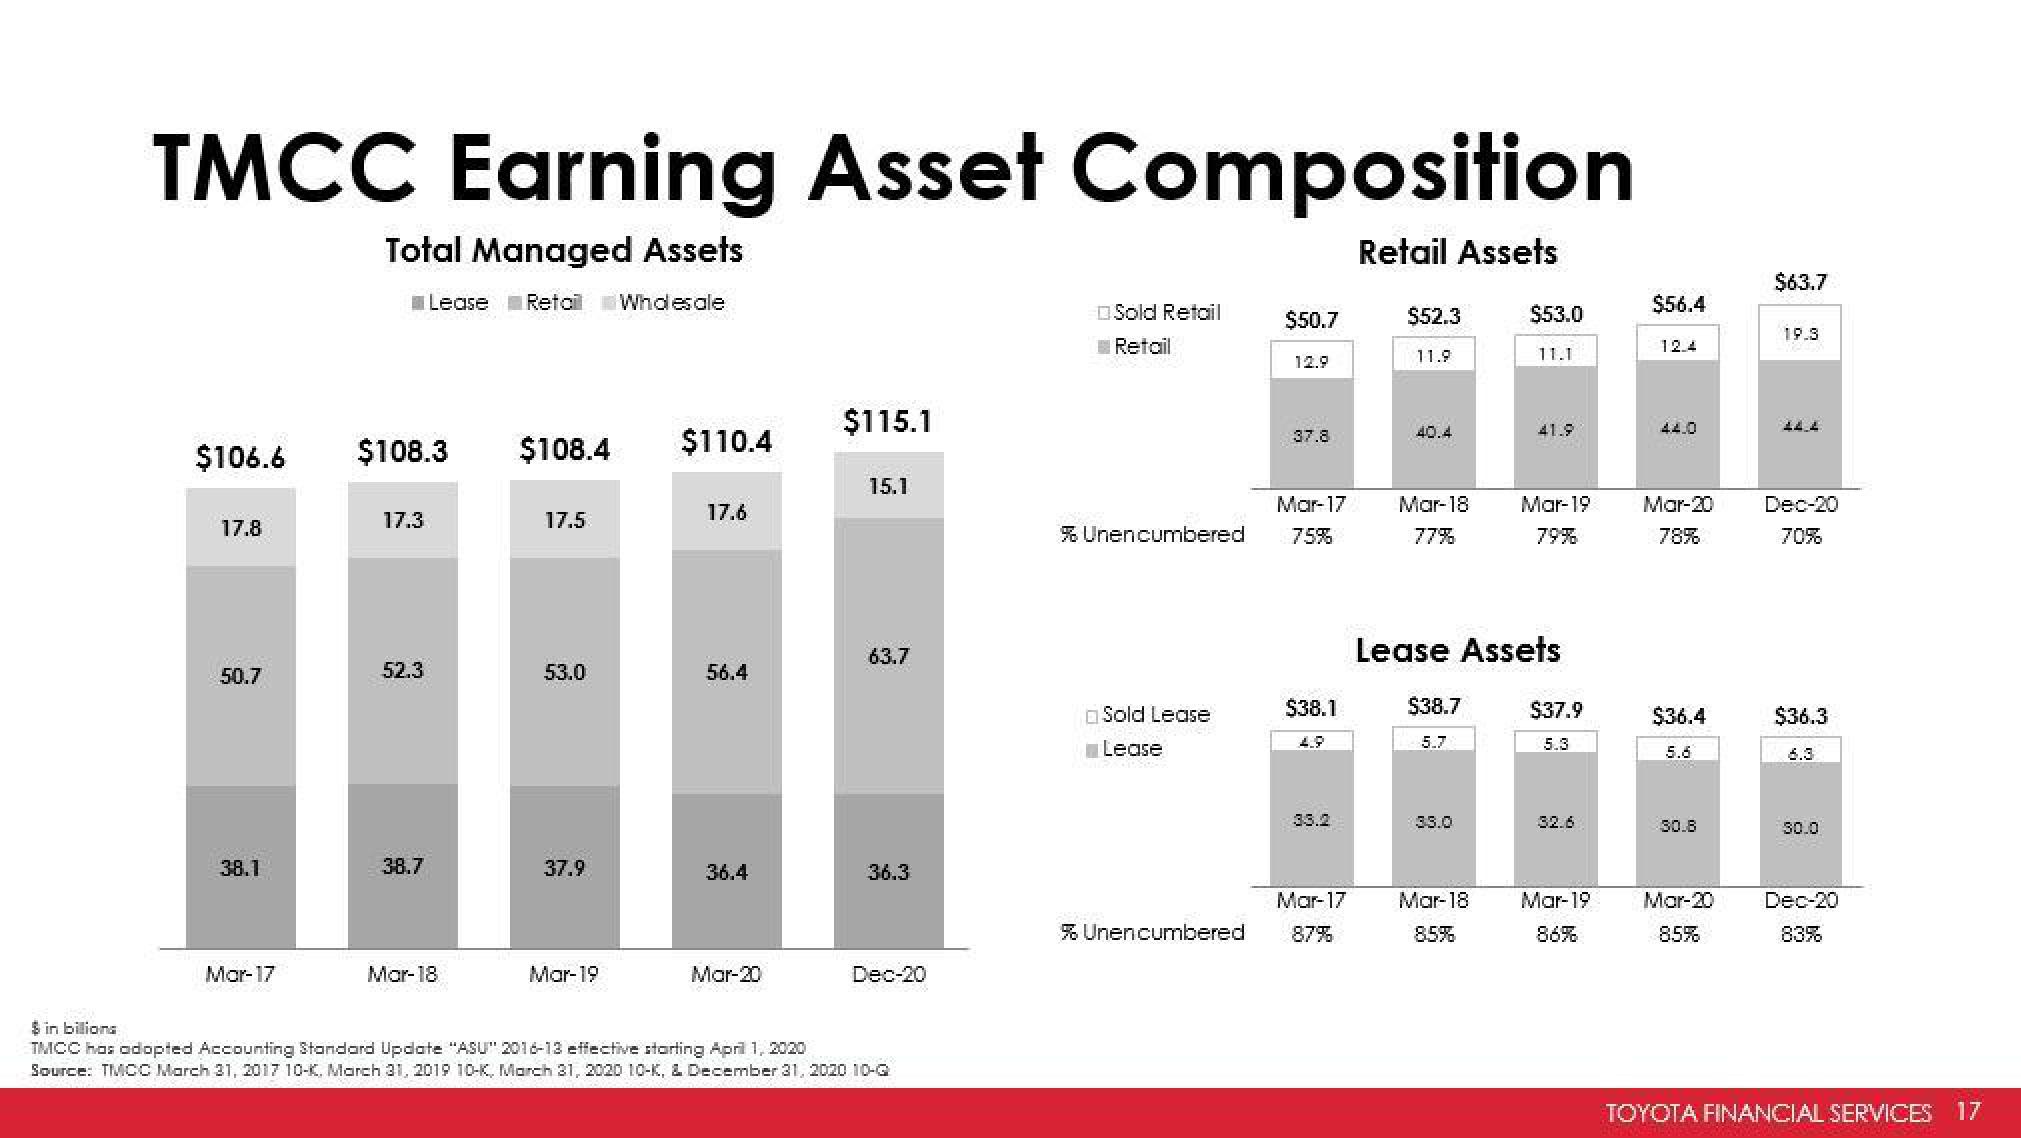
TMCC Earning Asset Composition
Total Managed Assets
Retail Assets
Lease Retail Wholesale
$106.6
17.8
50.7
38.1
Mor-17
$108.3
17.3
52.3
38.7
Mar-18
$108.4
17.5
53.0
37.9
Mar-19
$110.4
17.6
56.4
36.4
Mar-20
$115.1
15.1
63.7
36.3
Dec-20
$ in billions
TMCC has adopted Accounting Standard Update "ASU" 2016-13 effective starting April 1, 2020
Source: TMCC March 31, 2017 10-K, March 31, 2019 10-K, March 31, 2020 10-K, & December 31, 2020 10-G
Sold Retail
Retail
% Unencumbered
Sold Lease
Lease
% Unencumbered
$50.7
12.9
37.8
Mar-17
75%
$38.1
33.2
Mar-17
87%
$52.3
11.9
40.4
Mar-18
77%
33.0
$53.0
Mar-18
8.5%
11.1
41.9
Lease Assets
$38.7
5.7
Mar-19
79%
$37.9
5.3
32.6
Mar-19
86%
$56.4
12.4
44.0
Mar-20
78%
$36.4
5.6
30.8
Mar-20
85%
$63.7
19.3
44.4
Dec-20
70%
$36.3
6.3
30.0
Dec-20
83%
TOYOTA FINANCIAL SERVICES 17View entire presentation