Apollo Global Management Investor Presentation Deck
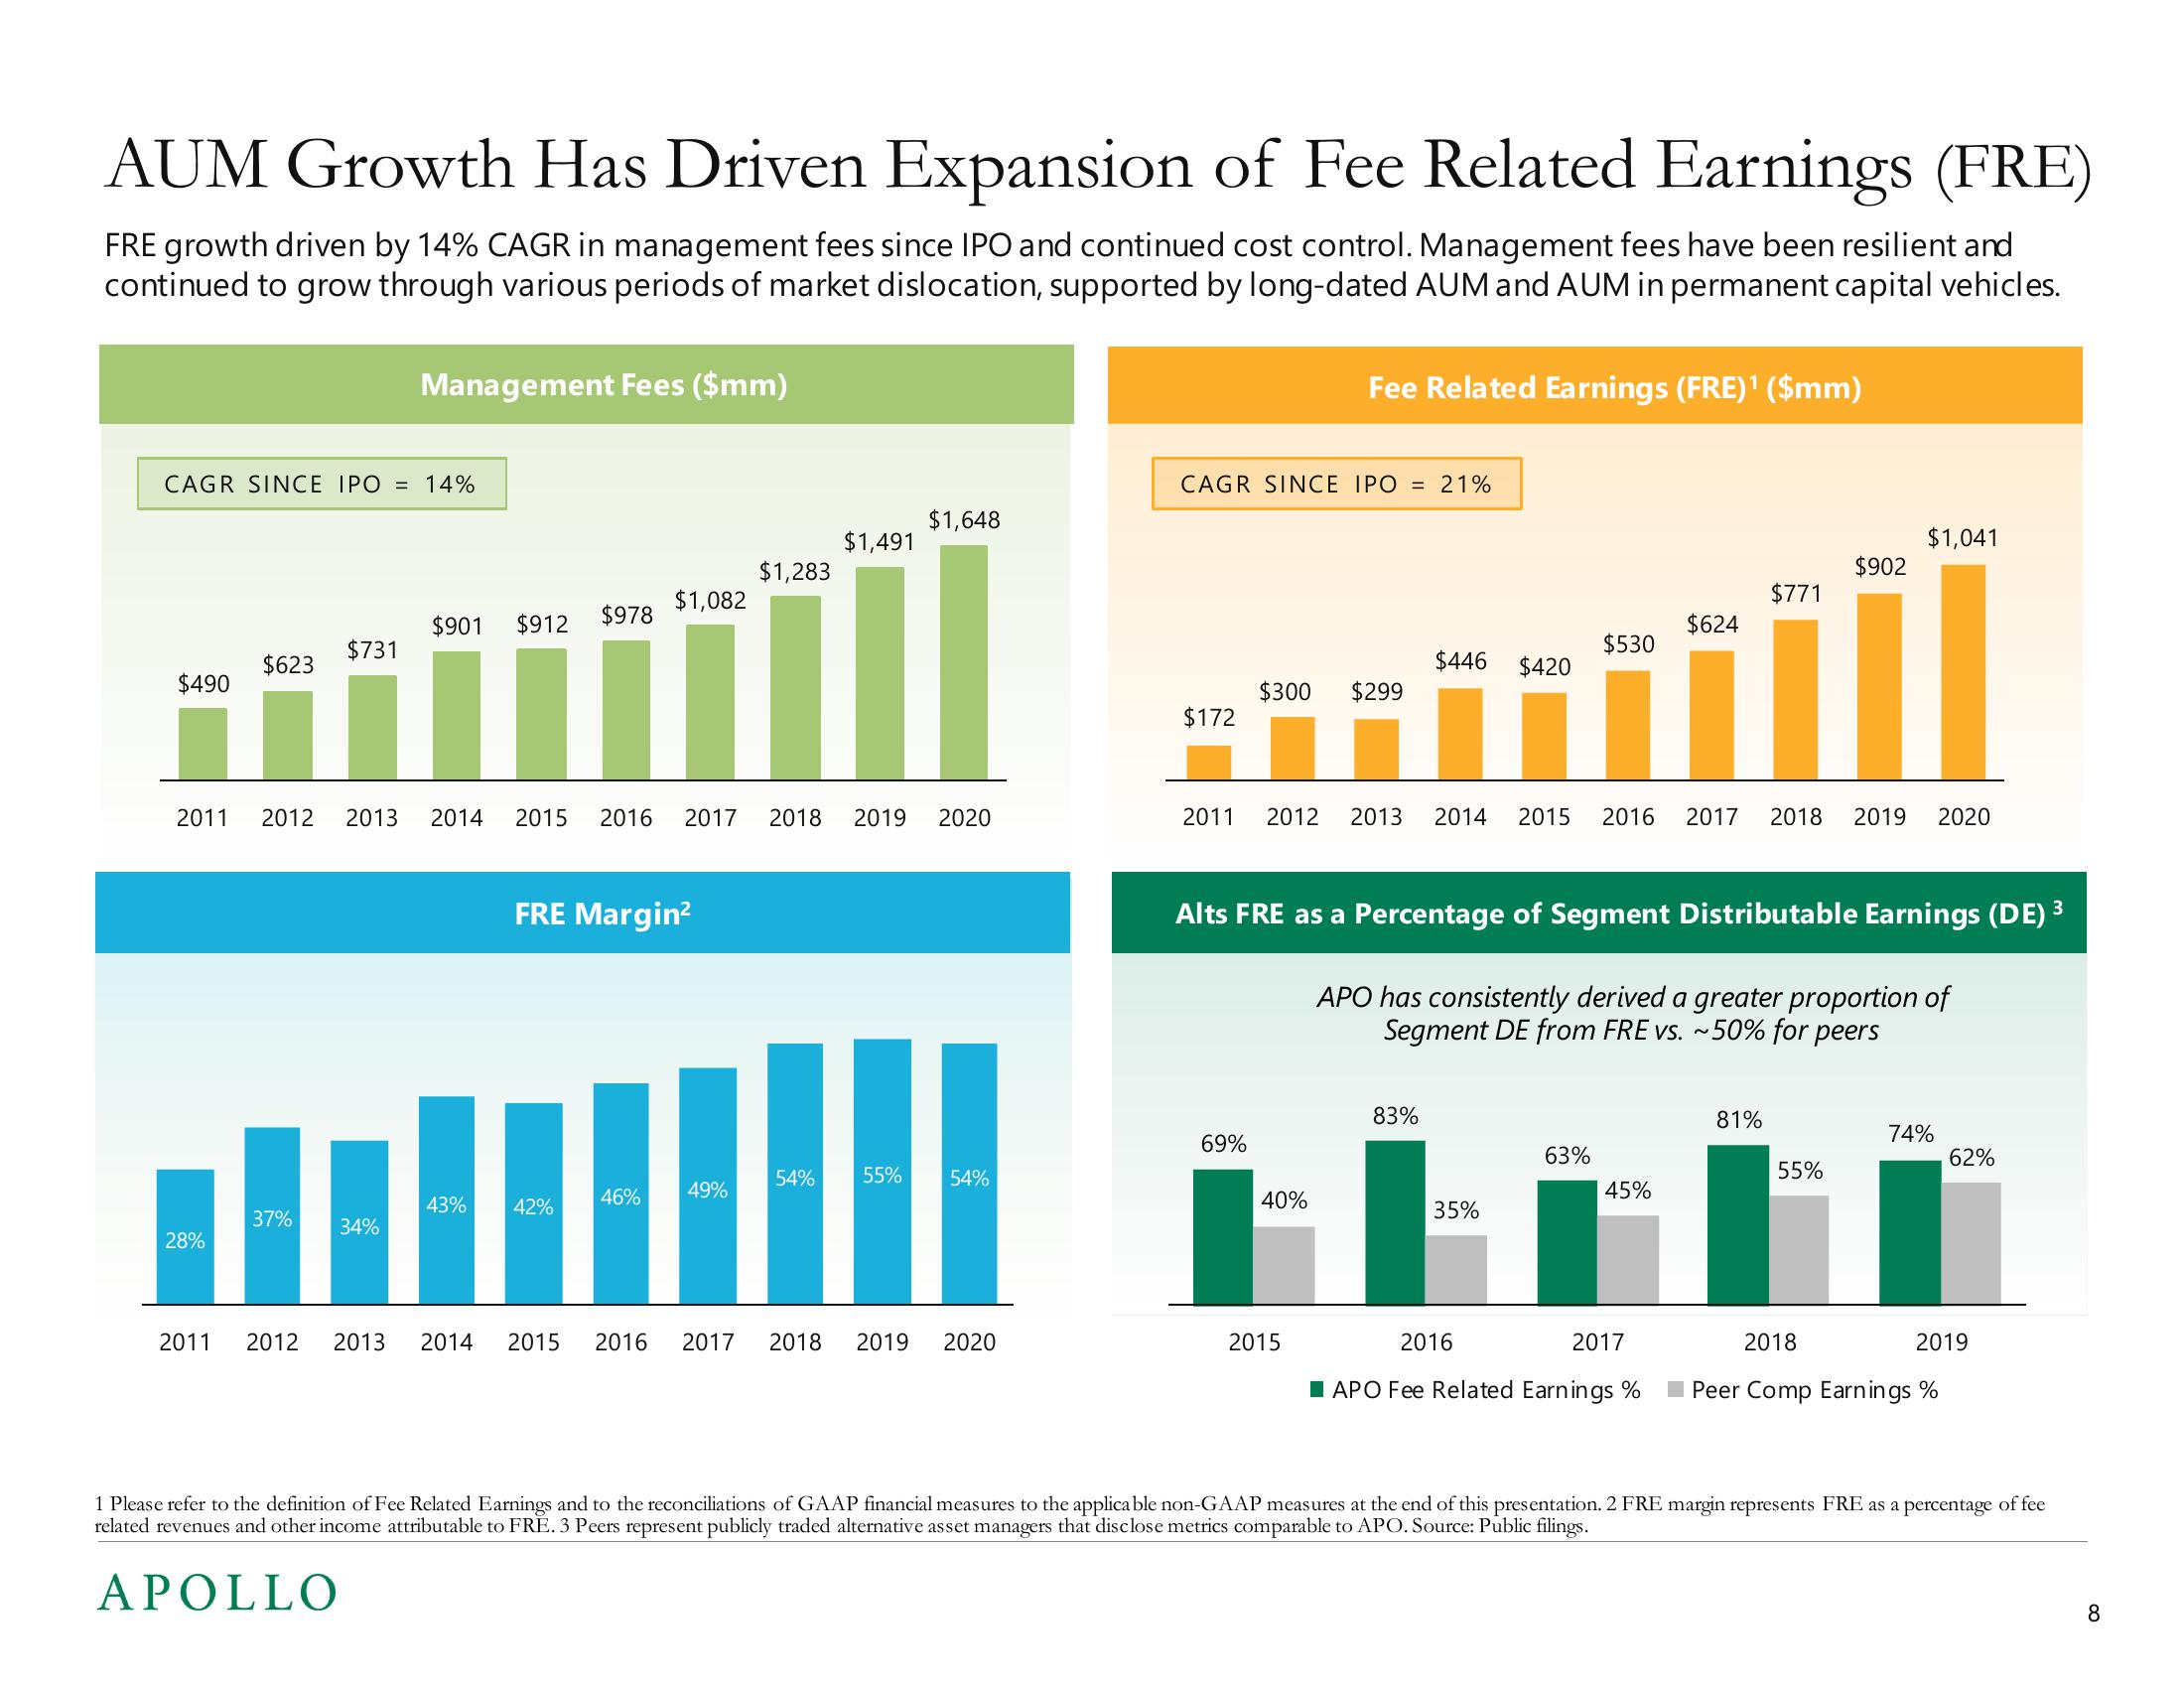
AUM Growth Has Driven Expansion of Fee Related Earnings (FRE)
FRE growth driven by 14% CAGR in management fees since IPO and continued cost control. Management fees have been resilient and
continued to grow through various periods of market dislocation, supported by long-dated AUM and AUM in permanent capital vehicles.
CAGR SINCE IPO = 14%
$490
$623
28%
$731
37%
Management Fees ($mm)
34%
$901 $912
43%
$978
2011 2012 2013 2014 2015 2016 2017 2018 2019 2020
$1,082
42%
FRE Margin²
$1,283
46% 49%
$1,491
54%
$1,648
55% 54%
2011 2012 2013 2014 2015 2016 2017 2018 2019 2020
CAGR SINCE IPO = 21%
$172
Fee Related Earnings (FRE)¹ ($mm)
$300 $299
69%
40%
2015
$446 $420
2011 2012 2013 2014 2015 2016 2017 2018 2019 2020
83%
$530
Alts FRE as a Percentage of Segment Distributable Earnings (DE) ³
3
35%
63%
$624
APO has consistently derived a greater proportion of
Segment DE from FRE vs. ~50% for peers
45%
$771
2016
2017
APO Fee Related Earnings %
$902
81%
$1,041
55%
74%
2018
Peer Comp Earnings %
62%
2019
1 Please refer to the definition of Fee Related Earnings and to the reconciliations of GAAP financial measures to the applicable non-GAAP measures at the end of this presentation. 2 FRE margin represents FRE as a percentage of fee
related revenues and other income attributable to FRE. 3 Peers represent publicly traded alternative asset managers that disclose metrics comparable to APO. Source: Public filings.
APOLLO
8View entire presentation