Nexters Results Presentation Deck
Diversification across key platforms and geographies
$m
Bookings by platform (¹)
Desktop
Mobile
120
70%
30%
Q4 2020
445
74%
26%
FY 2020
+20%
+26%
144
71%
29%
Q4 2021
562
68%
32%
FY 2021
YoY
22%
15%
YoY
15%
57%
Source: Company information (preliminary and unaudited)
1)
For platform and geography splits corresponding shares in management accounts were used
$m.
Bookings by geography (¹)
US
Europe
120
33%
25%
20%
15%
7%
Q4 2020
445
37%
24%
16%
15%
8%
FY 2020
Asia
+20%
+26%
FSU
144
30%
20%
26%
14%
10%
Q4 2021
562
31%
22%
25%
13%
9%
FY 2021
Other
YoY
9%
-3%
58%
12%
58%
YoY
6%
15%
90%
12%
46%
nexters
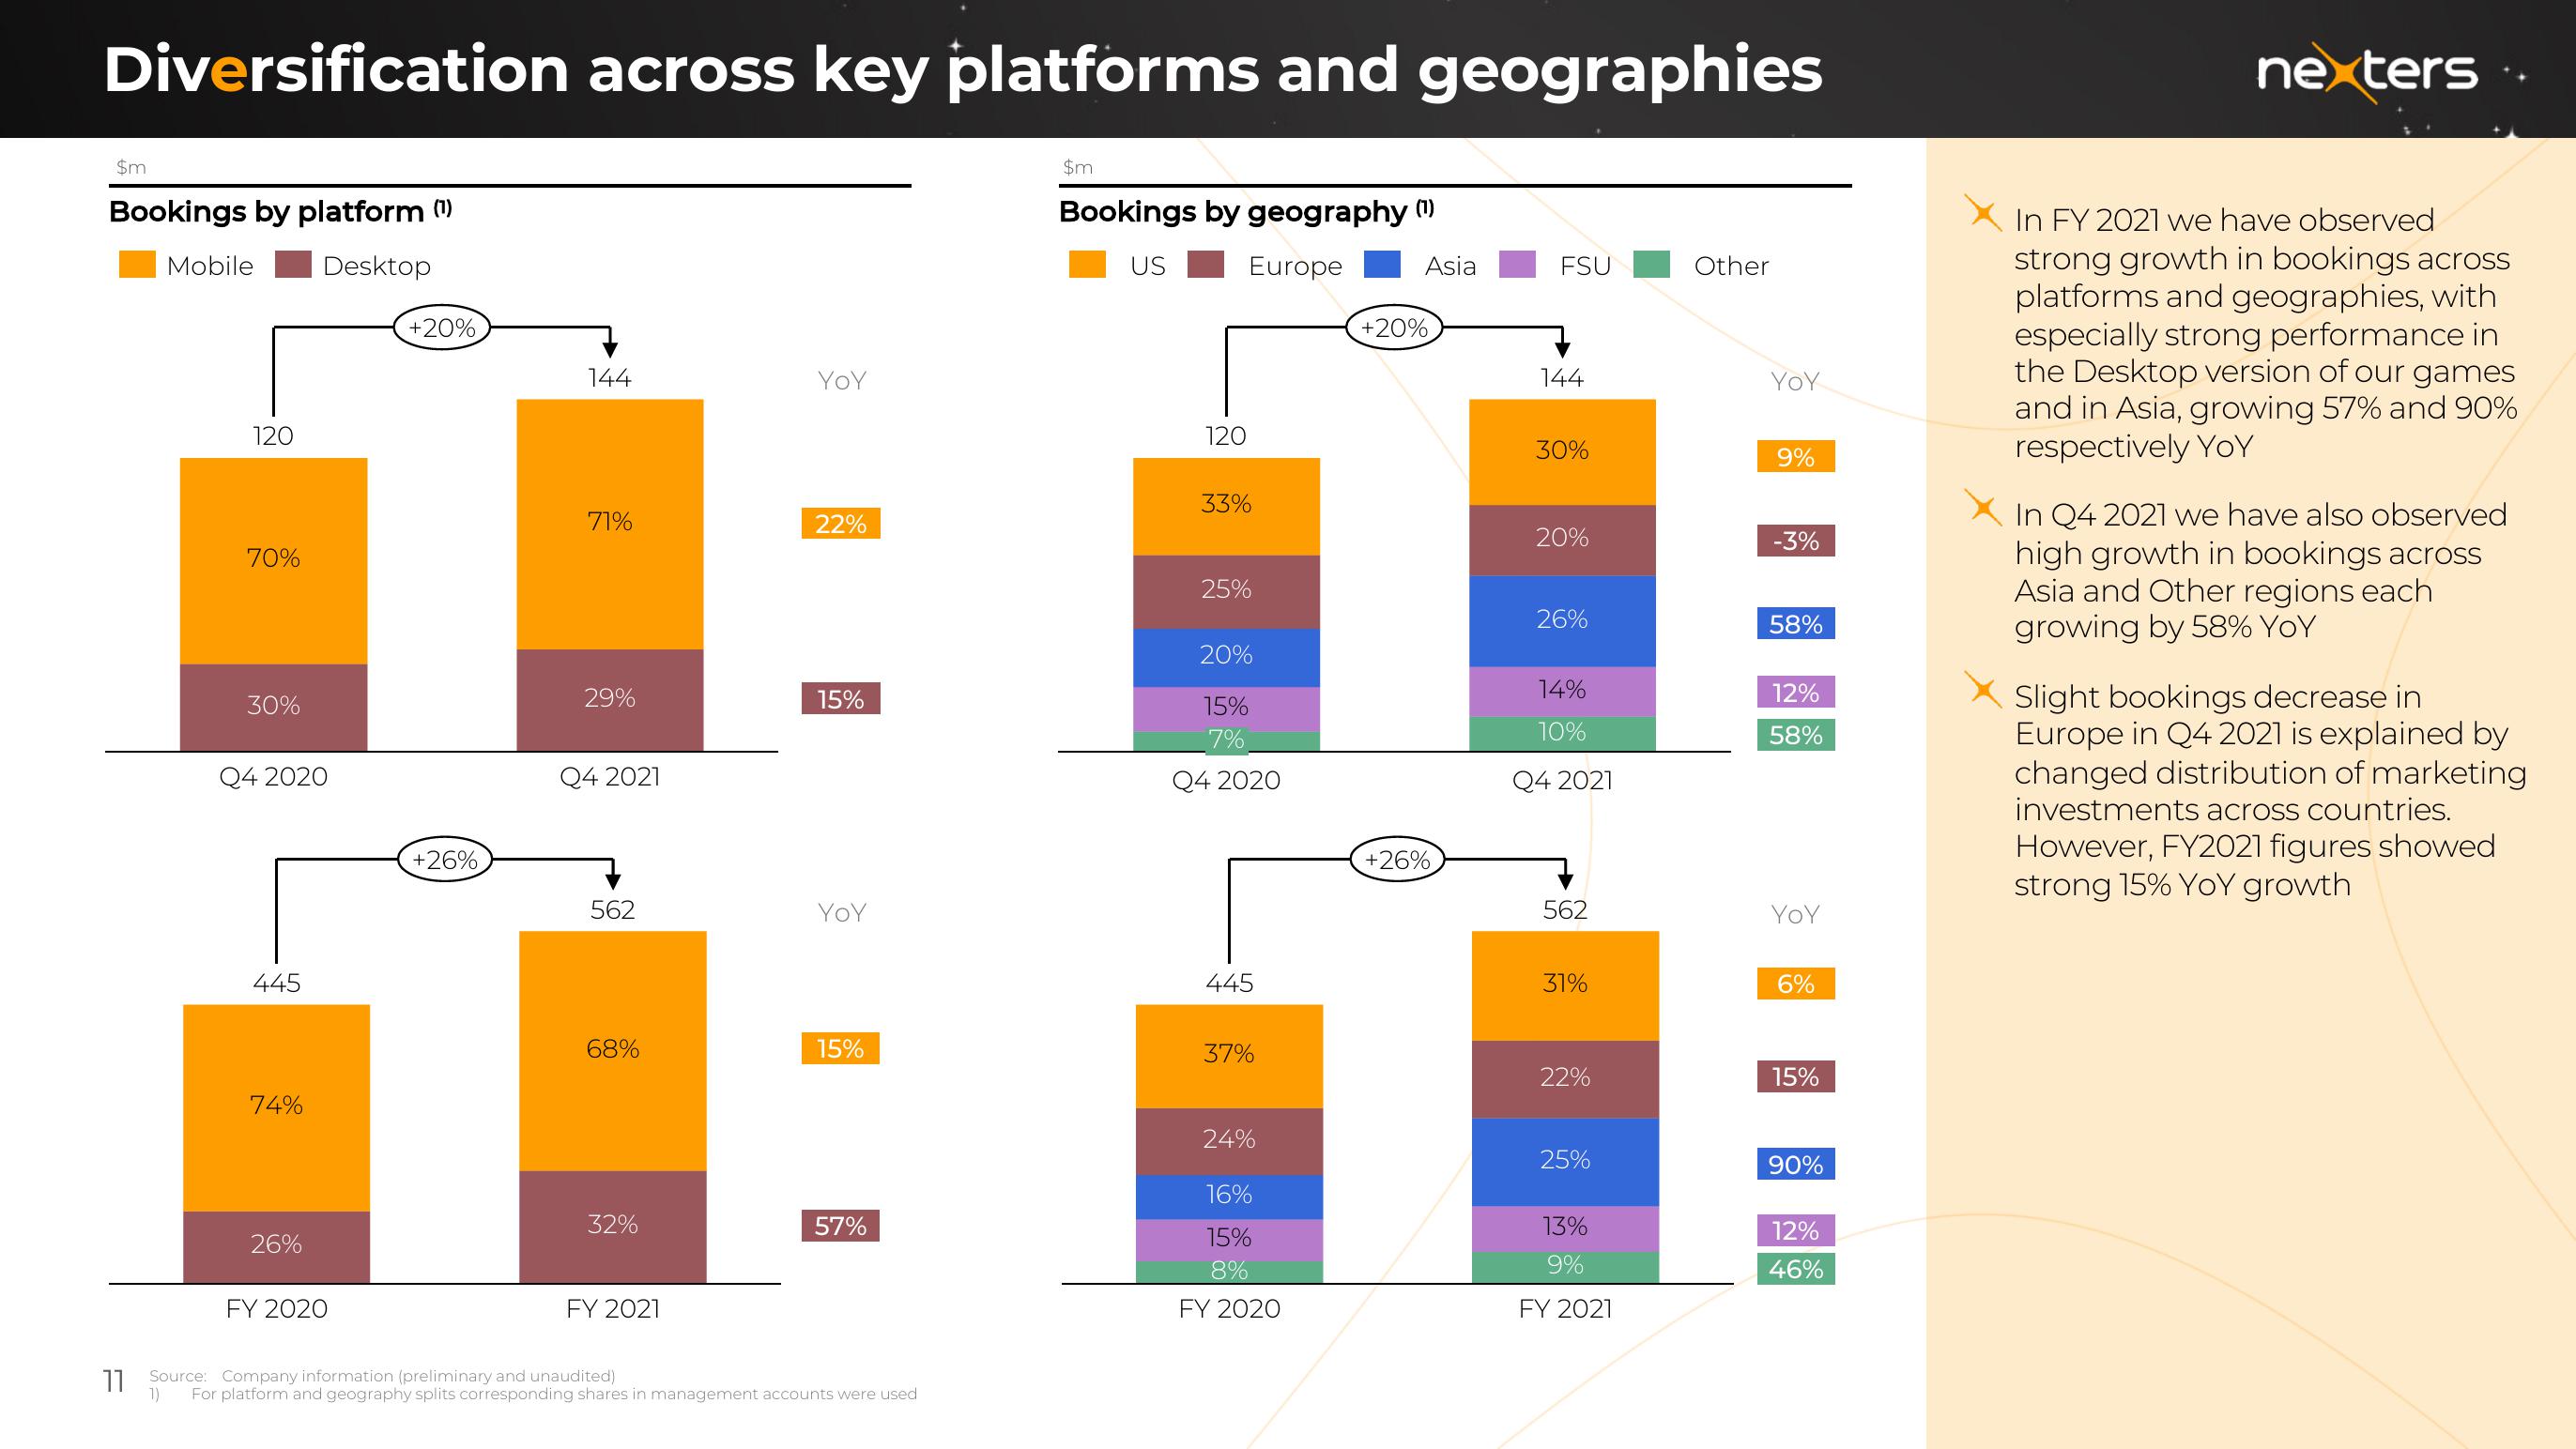
In FY 2021 we have observed
strong growth in bookings across
platforms and geographies, with
especially strong performance in
the Desktop version of our games
and in Asia, growing 57% and 90%
respectively YoY
In Q4 2021 we have also observed
high growth in bookings across
Asia and Other regions each
growing by 58% YoY
Slight bookings decrease in
Europe in Q4 2021 is explained by
changed distribution of marketing
investments across countries.
However, FY2021 figures showed
strong 15% YoY growthView entire presentation