Main Street Capital Investor Day Presentation Deck
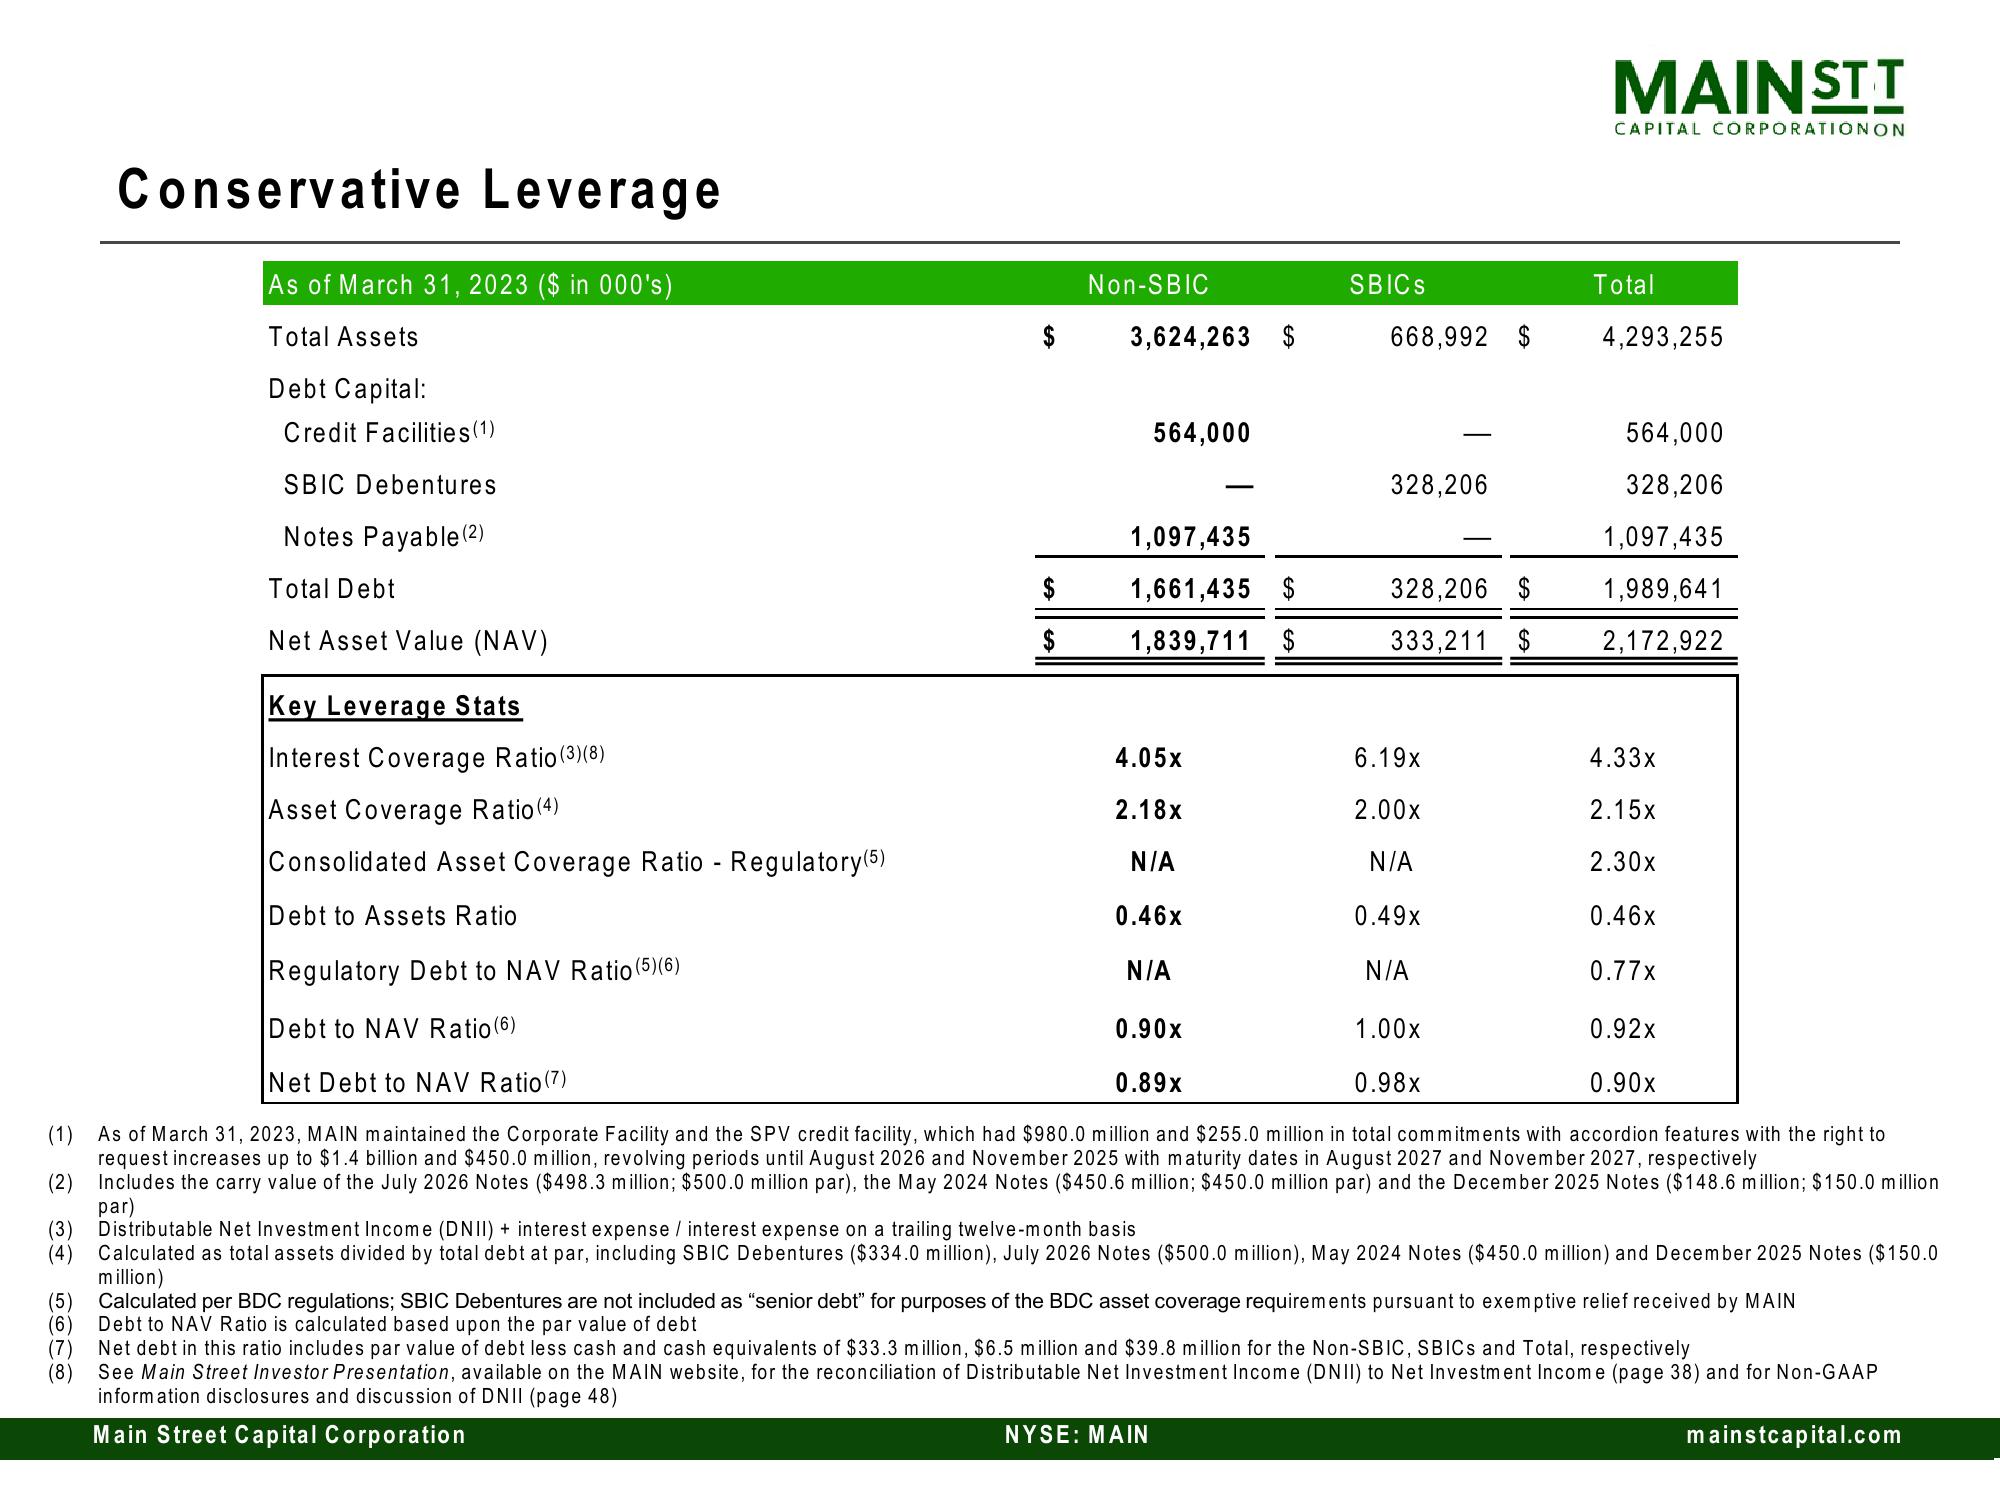
Conservative Leverage
=
As of March 31, 2023 ($ in 000's)
Total Assets
Debt Capital:
Credit Facilities (1)
SBIC Debentures
Notes Payable (2)
Total Debt
Net Asset Value (NAV)
$
$
Non-SBIC
3,624,263 $
564,000
1,097,435
1,661,435 $
1,839,711 $
4.05x
2.18x
N/A
0.46x
N/A
SBICS
668,992
328,206
NYSE: MAIN
328,206 $
333,211 $
MAINST T
6.19x
2.00x
N/A
0.49x
N/A
CAPITAL CORPORATIONON
Key Leverage Stats
Interest Coverage Ratio (3)(8)
4.33x
2.15x
Asset Coverage Ratio (4)
Consolidated Asset Coverage Ratio - Regulatory(5)
2.30x
Debt to Assets Ratio
0.46x
Regulatory Debt to NAV Ratio (5) (6)
0.77x
Debt to NAV Ratio (6)
0.90x
1.00x
0.92x
Net Debt to NAV Ratio (7)
0.89x
0.98x
0.90x
(1) As of March 31, 2023, MAIN maintained the Corporate Facility and the SPV credit facility, which had $980.0 million and $255.0 million in total commitments with accordion features with the right to
request increases up to $1.4 billion and $450.0 million, revolving periods until August 2026 and November 2025 with maturity dates in August 2027 and November 2027, respectively
(2) Includes the carry value of the July 2026 Notes ($498.3 million; $500.0 million par), the May 2024 Notes ($450.6 million; $450.0 million par) and the December 2025 Notes ($148.6 million; $150.0 million
par)
Total
4,293,255
564,000
328,206
1,097,435
1,989,641
2,172,922
(3) Distributable Net Investment Income (DNII) + interest expense / interest expense on a trailing twelve-month basis
(4) Calculated as total assets divided by total debt at par, including SBIC Debentures ($334.0 million), July 2026 Notes ($500.0 million), May 2024 Notes ($450.0 million) and December 2025 Notes ($150.0
million)
(5)
Calculated per BDC regulations; SBIC Debentures are not included as "senior debt" for purposes of the BDC asset coverage requirements pursuant to exemptive relief received by MAIN
(6) Debt to NAV Ratio is calculated based upon the par value of debt
(7) Net debt in this ratio includes par value of debt less cash and cash equivalents of $33.3 million, $6.5 million and $39.8 million for the Non-SBIC, SBICs and Total, respectively
(8)
See Main Street Investor Presentation, available on the MAIN website, for the reconciliation of Distributable Net Investment Income (DNII) to Net Investment Income (page 38) and for Non-GAAP
information disclosures and discussion of DNII (page 48)
Main Street Capital Corporation
mainstcapital.comView entire presentation