Baird Investment Banking Pitch Book
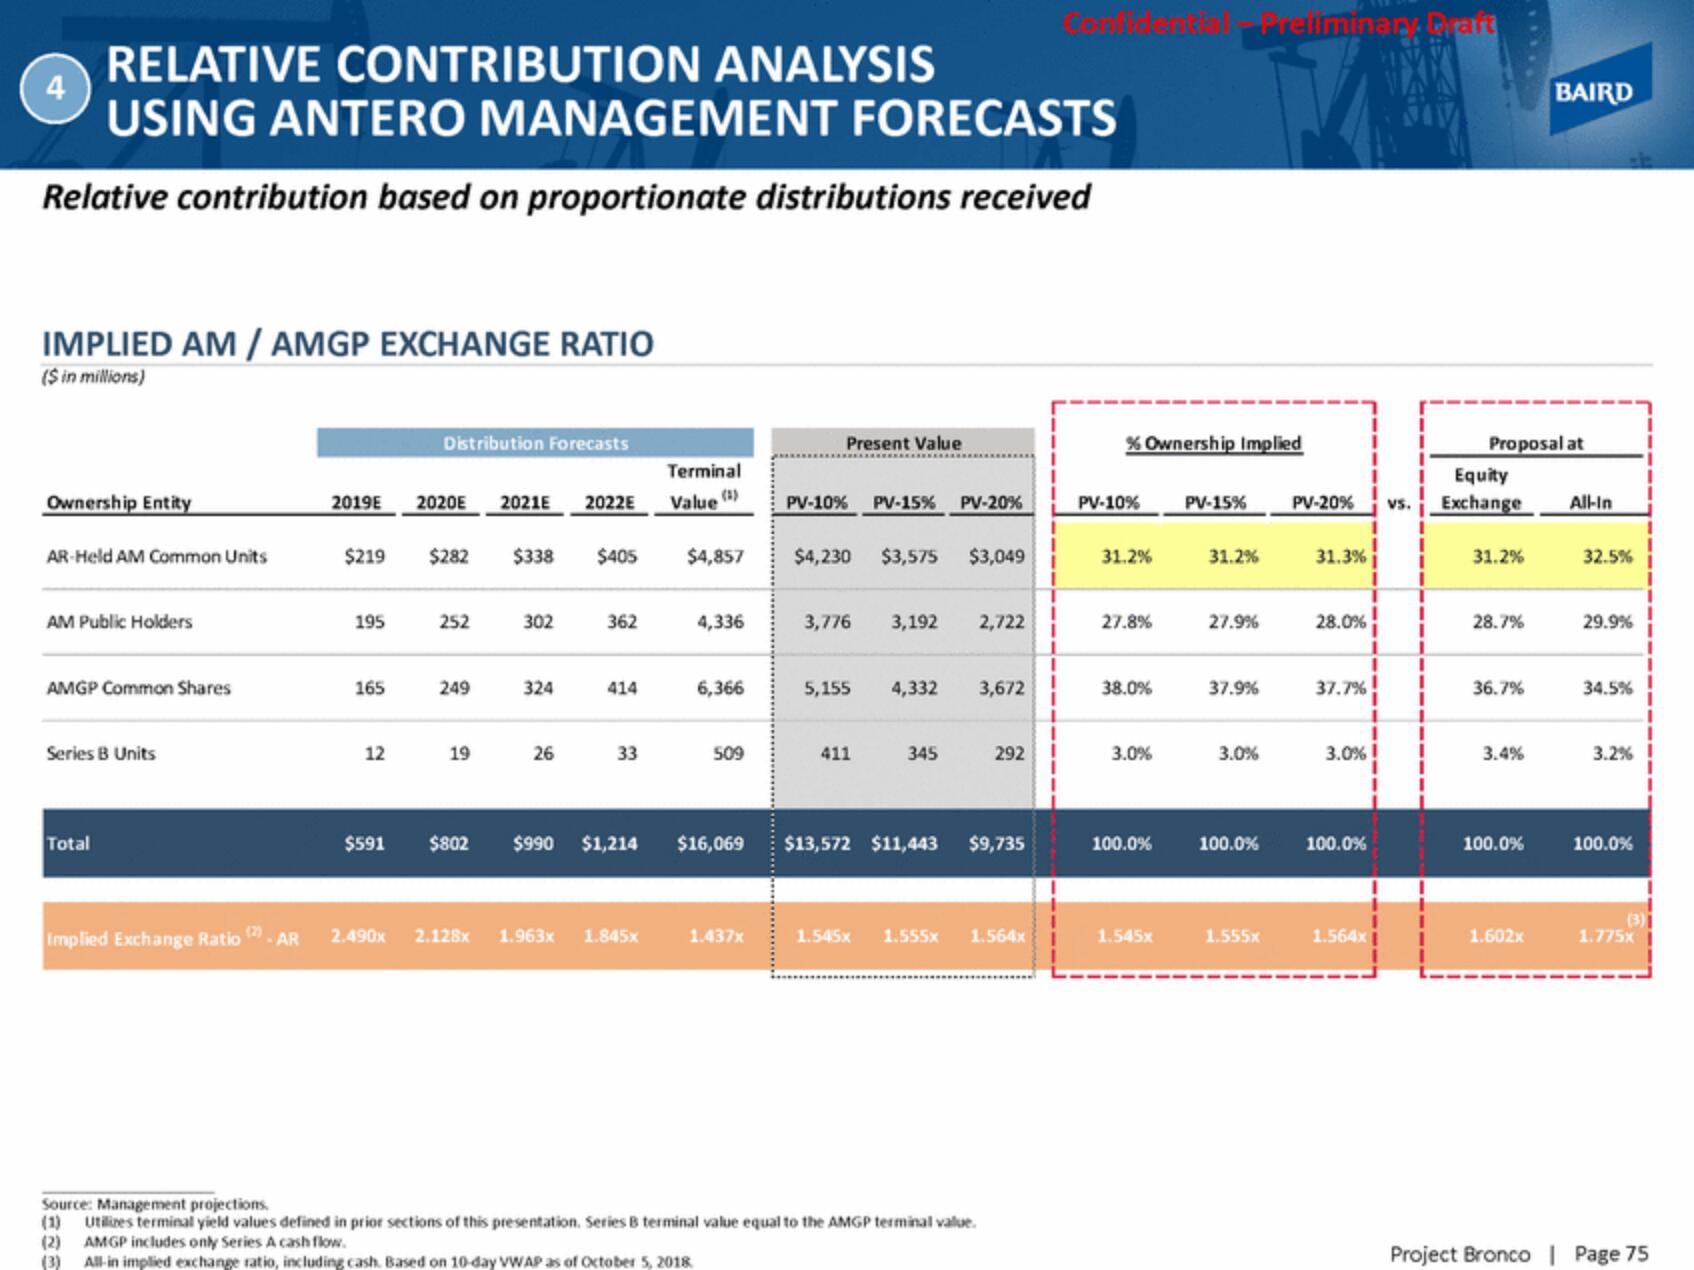
RELATIVE CONTRIBUTION ANALYSIS
USING ANTERO MANAGEMENT FORECASTS
Relative contribution based on proportionate distributions received
4
IMPLIED AM / AMGP EXCHANGE RATIO
($ in millions)
Ownership Entity
AR-Held AM Common Units
AM Public Holders
AMGP Common Shares
Series B Units
Total
2019E
$219
195
165
12
$591
Distribution Forecasts
2020E 2021E 2022E
$282 $338 $405
252
249
19
302
324
26
362
414
33
Terminal
Value (1)
Implied Exchange Ratio -AR 2.490x 2.128x 1.963x 1.845x
$4,857
4,336
6,366
509
Present Value
1.437x
PV-10% PV-15% PV-20%
$4,230 $3,575 $3,049
3,776 3,192
5,155 4,332
411
345
2,722
3,672
$802 $990 $1,214 $16,069 $13,572 $11,443 $9,735
292
1.545x 1.555x 1.564x
Source: Management projections.
Utilizes terminal yield values defined in prior sections of this presentation. Series B terminal value equal to the AMGP terminal value.
(2) AMGP includes only Series A cash flow.
(3) All-in implied exchange ratio, including cash. Based on 10-day VWAP as of October 5, 2018
Contventil Freliminary Draft
1
% Ownership Implied
PV-10%
31.2%
27.8%
38.0%
3.0%
100.0%
1.545x
PV-15%
31.2%
27.9%
37.9%
3.0%
100.0%
1.555x
PV-20% VS.
31.3%
28.0%
37.7%
3.0%!
100.0%
1
1.564x
Proposal at
Equity
Exchange All-In
31.2%
28.7%
36.7%
3.4%
BAIRD
100.0%
1.602x
32.5%
29.9%
34.5%
3.2%
100.0%
(3)
1.775x
Project Bronco | Page 75View entire presentation