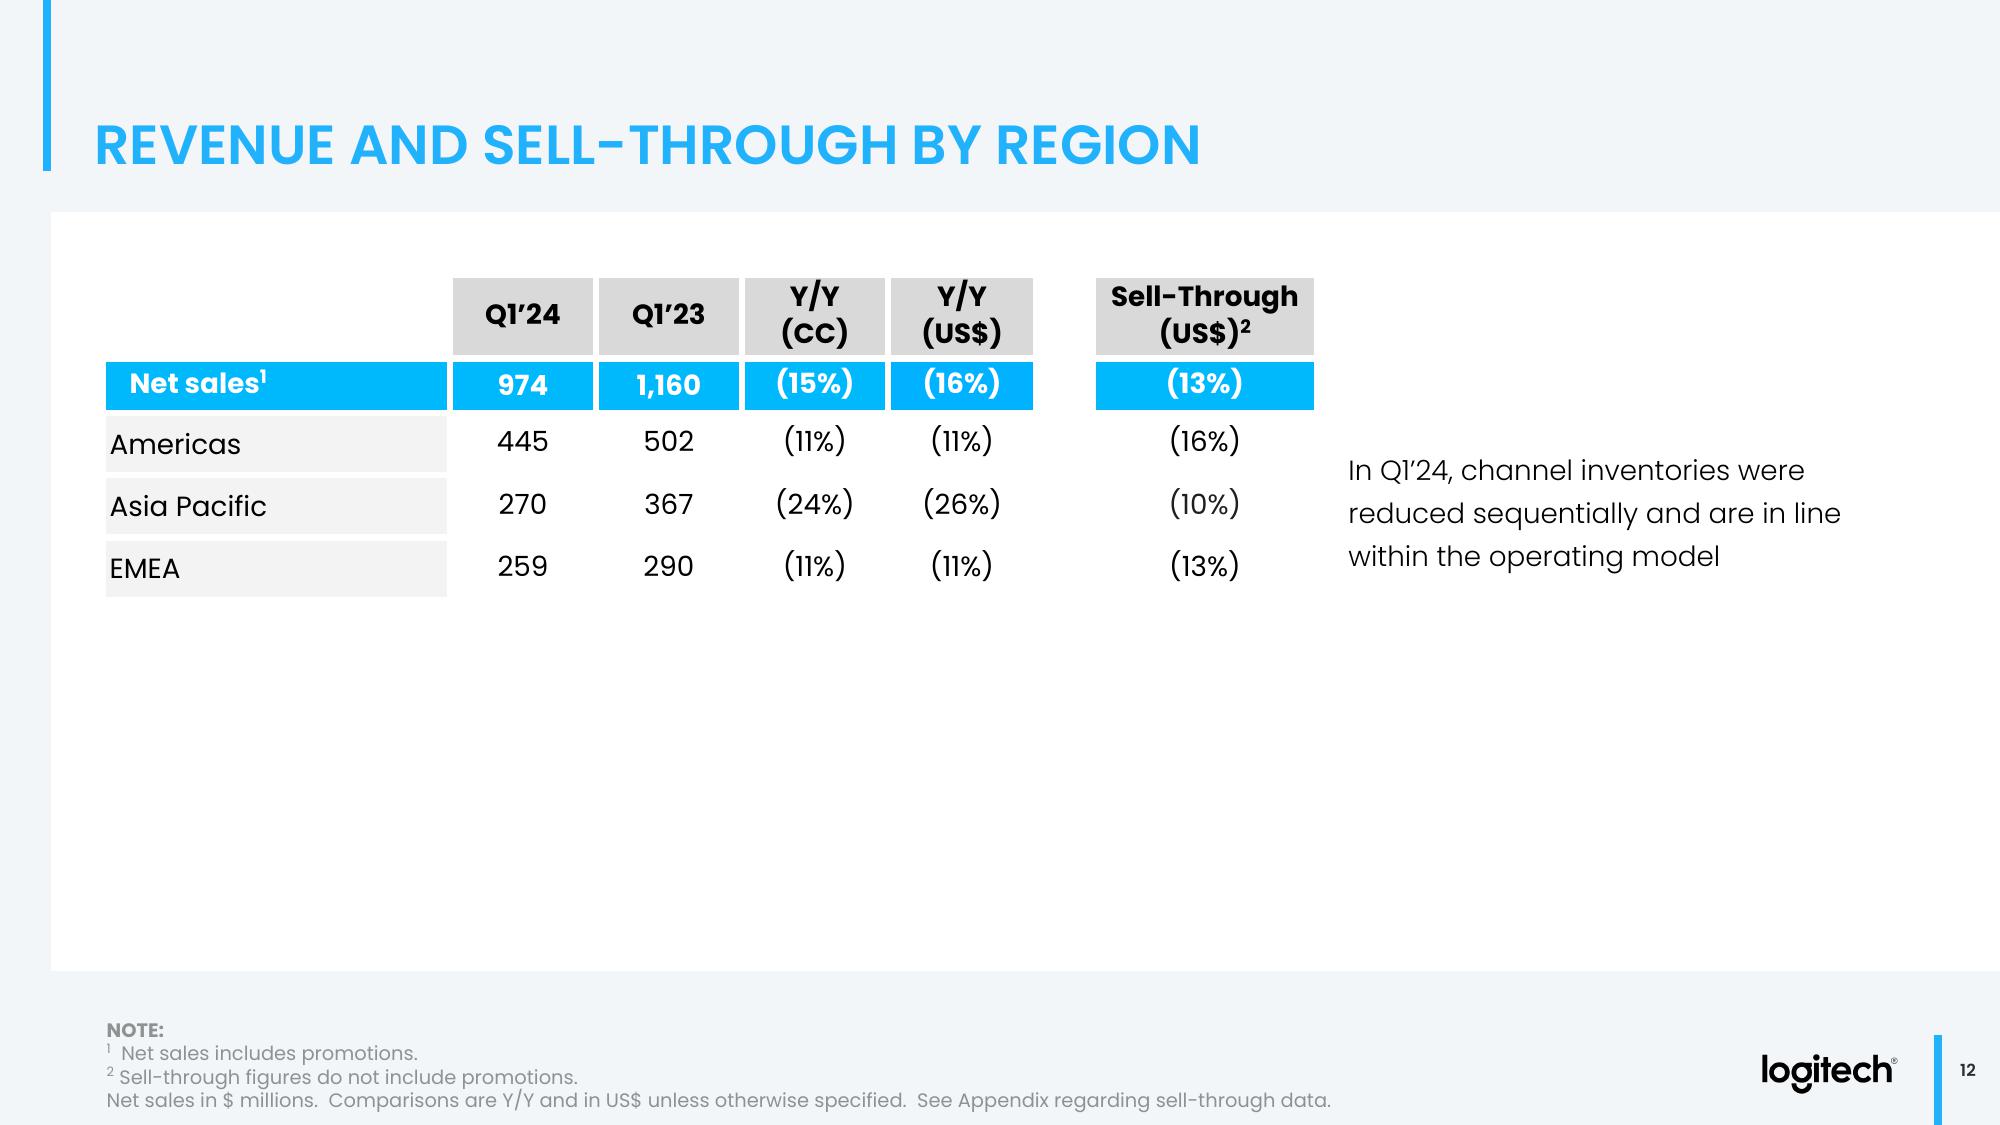
Q1 Fiscal Year 2024 Financial Results
Categories
Finance PresentationsTechnology PresentationsBanking PresentationsInformation Technology PresentationsOil and Energy PresentationsInternet PresentationsMining and Metals PresentationsCommunications PresentationsReal Estate PresentationsBiotechnology PresentationsAutomotive PresentationsMedical PresentationsRetail PresentationsEnergy Presentations