First Citizens BancShares Results Presentation Deck
Funding Mix
($ in millions)
Total deposits
Securities sold under customer
repurchase agreements
Purchase money note
Federal Home Loan Bank borrowings
Subordinated debt
3.20%
2.80%
2.40%
2.00%
1.60%
1.20%
0.80%
0.40%
0.00%
0.66%
0.50%
0.35%
3Q22
Senior unsecured borrowings
Other borrowings
Total deposits and borrowed funds $ 183,945
First Citizens
BancShares
1.35%
1.12%
3Q23
0.78%
$ 146,233
Cost of funds
4Q22
453
35,833
1,040
377
9
1.94%
1.73%
1.24%
1Q23
79.5 %$ 141,164
0.2
19.5
0.6
0.2
2.99%
100% $ 181,303
2,56%
1.68%
2Q23
2Q23
Cost of interest-bearing liabilities
Cost of interest-bearing deposits
Cost of deposits
454
35,817
2,425
1,043
393
7
3.02%
0.3
19.8
1.3
0.6
0.2
3.19%
3Q23
77.9 % $ 140,050
2.12%
QTD - Period End Balances
1Q23
100% $ 186,144
Note - Funding mix percentages may not foot due to rounding.
509
35,151
8,500
1,046
881
7
●
●
75.2 % $
●
0.3
18.9
4.6
0.6
0.5
4Q22
89,408
436
4,250
1,049
885
25
100 % $ 96,053
93.1 % $ 87,553
0.5
4.4
1.1
0.9
3Q22
100 % $
578
5,800
1,052
888
25
95,896
Highlights
Change
Linked Prior Year
Quarter Quarter
91.3 % $ 5,069 $ 58,680
0.6
6.0
1.1
0.9
100 % $
(125)
35,833
(5,800)
(12)
(511)
(16)
2,642 $ 88,049
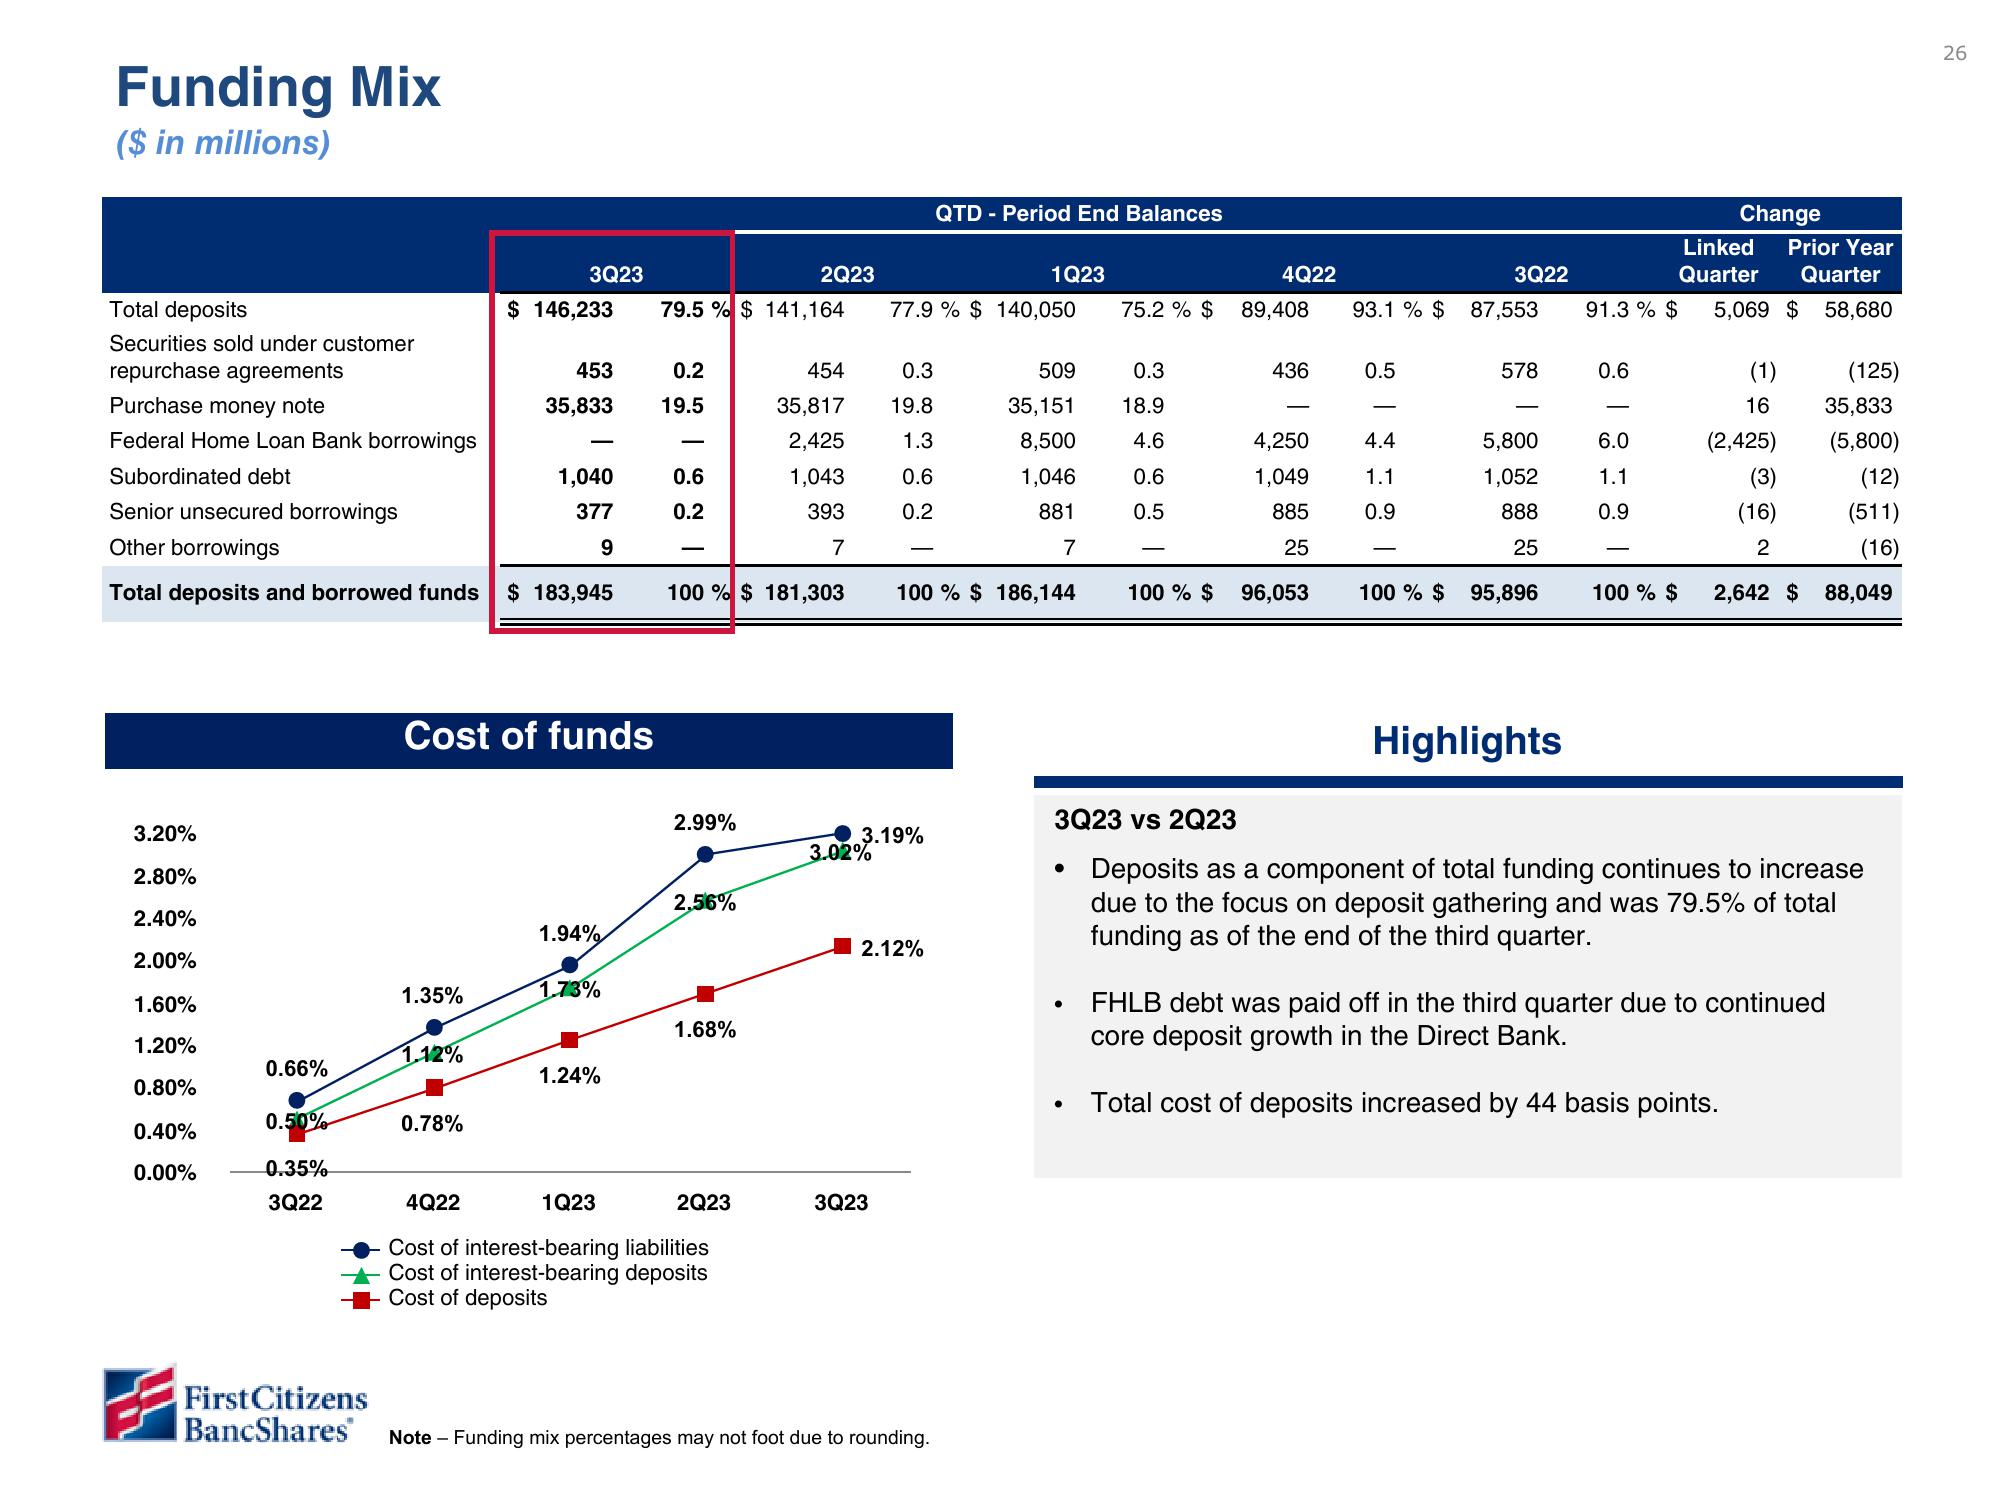
3Q23 vs 2Q23
Deposits as a component of total funding continues to increase
due to the focus on deposit gathering and was 79.5% of total
funding as of the end of the third quarter.
(1)
16
(2,425)
(3)
(16)
2
FHLB debt was paid off in the third quarter due to continued
core deposit growth in the Direct Bank.
Total cost of deposits increased by 44 basis points.
26View entire presentation