Bank of America Investment Banking Pitch Book
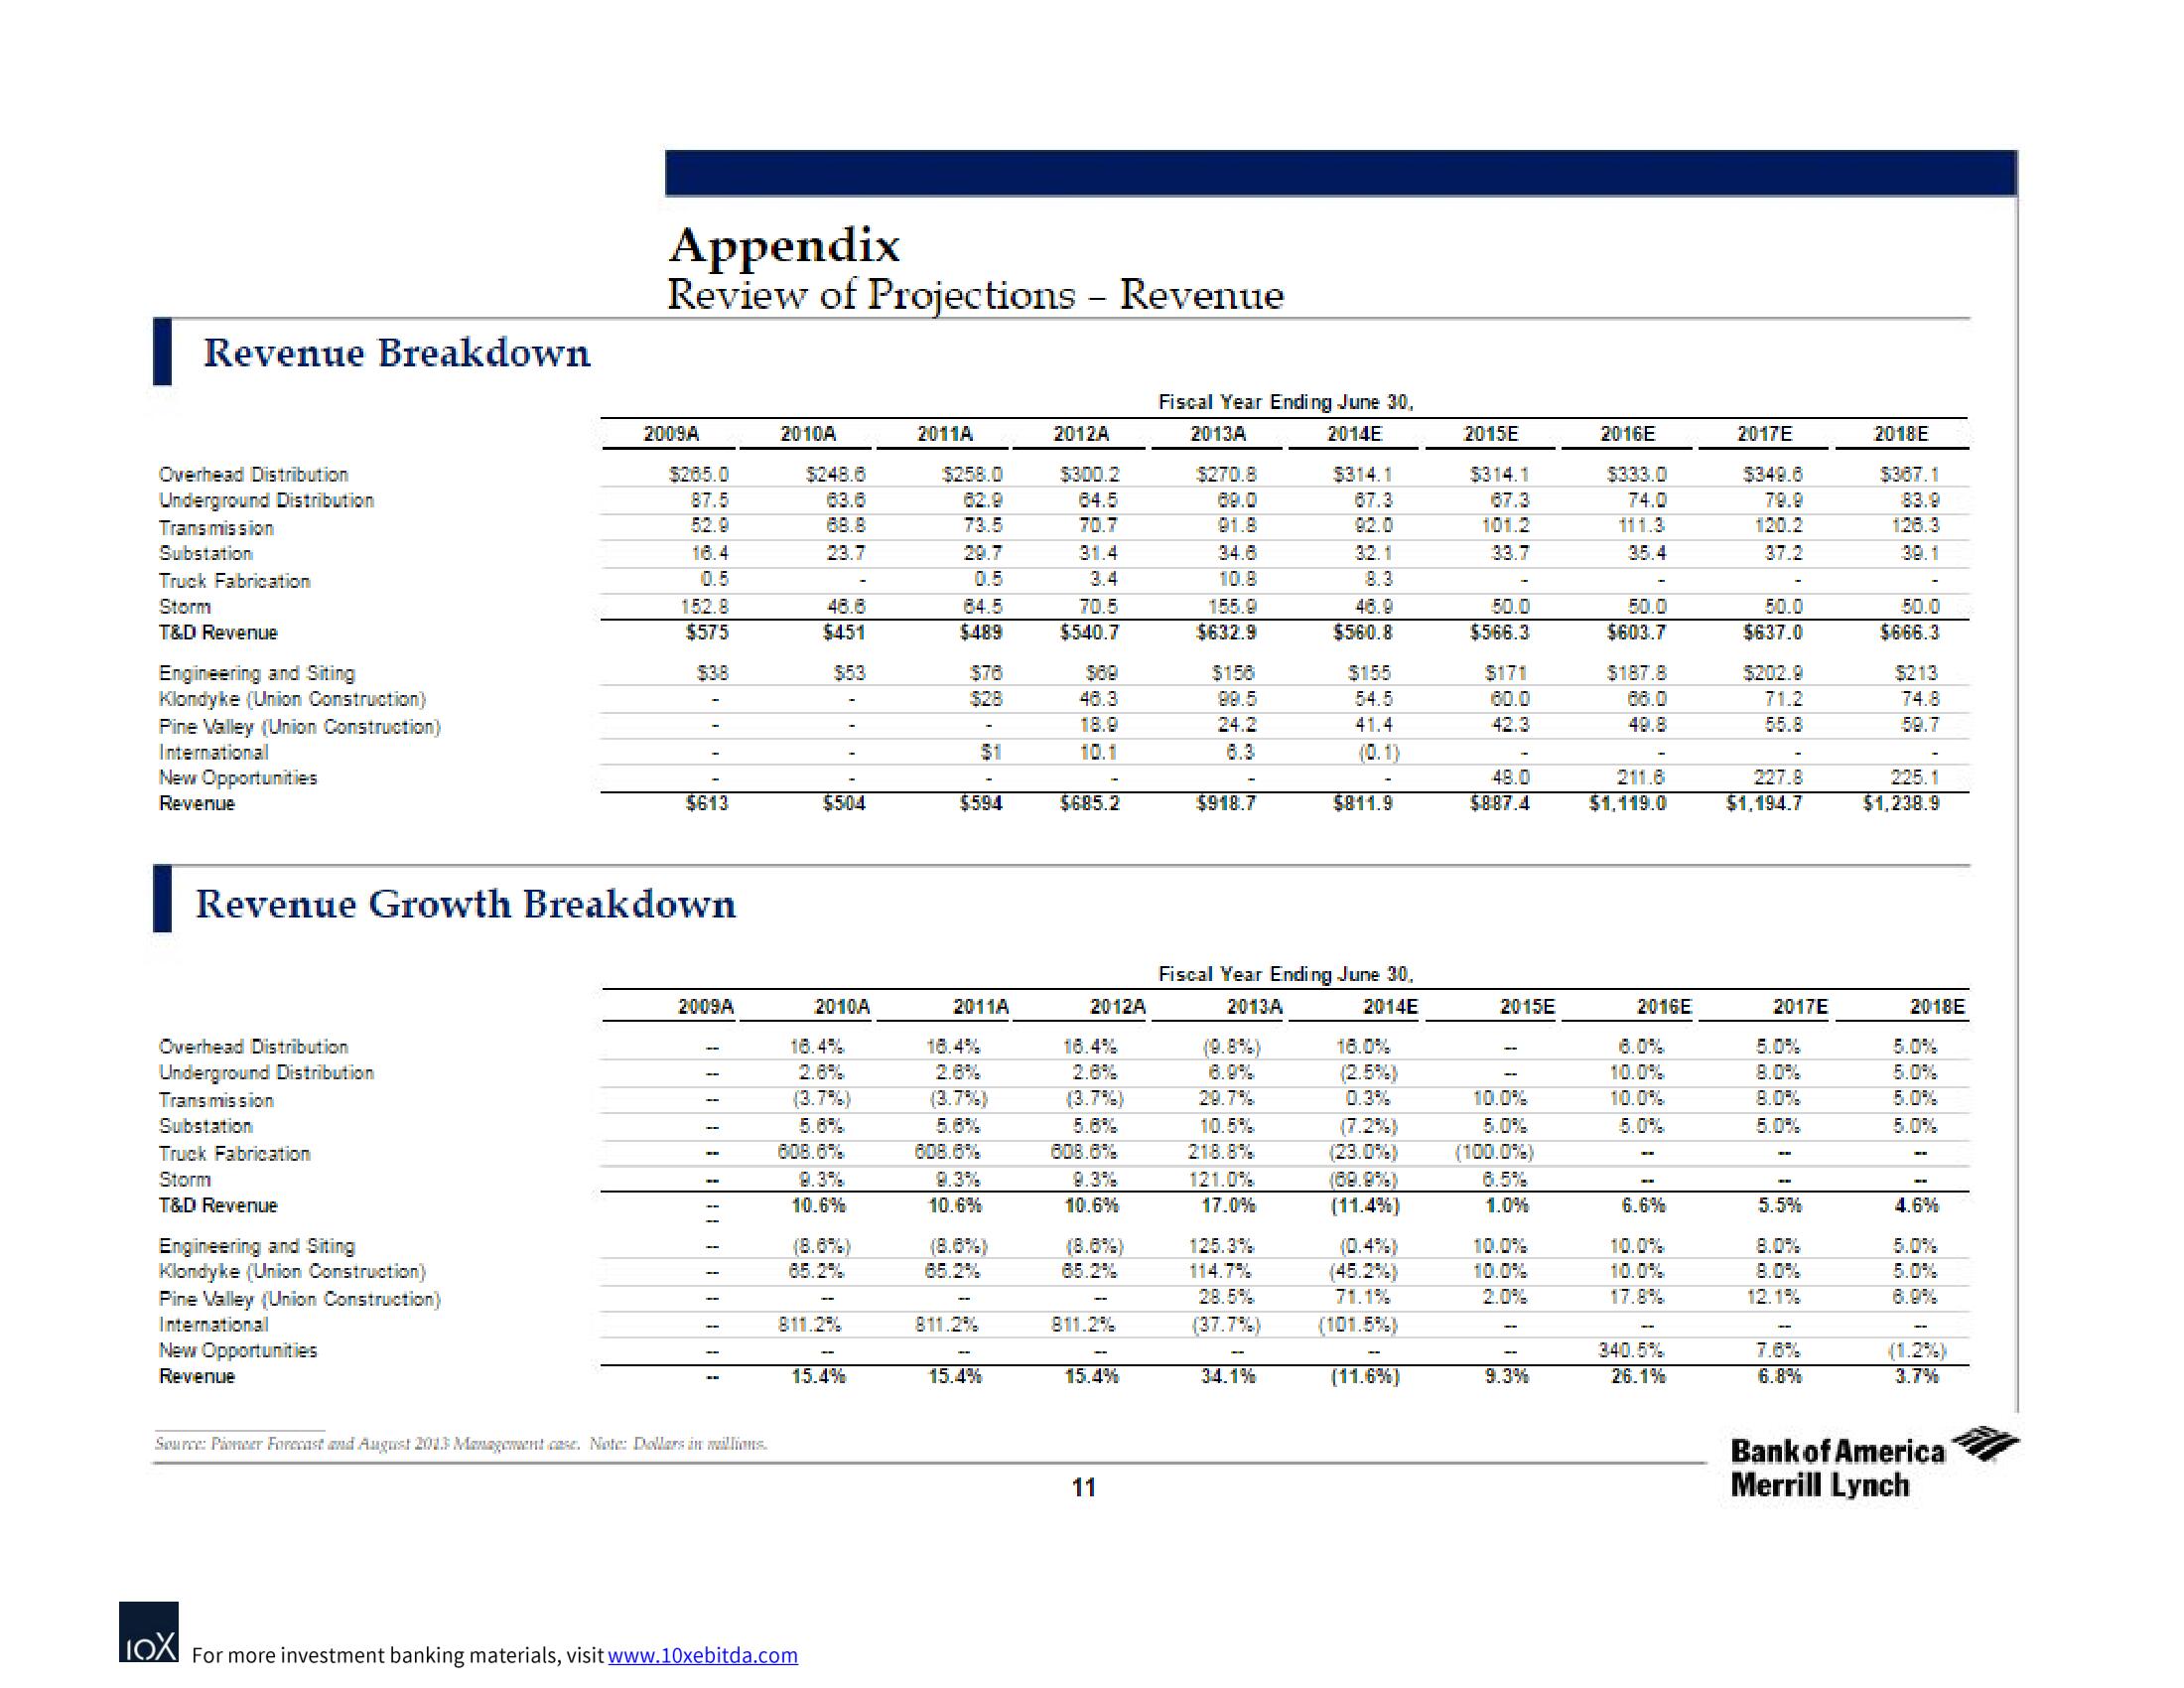
Revenue Breakdown
Overhead Distribution
Underground Distribution
Transmission
Substation
Truck Fabrication
Storm
T&D Revenue
Engineering and Siting
Klondyke (Union Construction)
Pine Valley (Union Construction)
International
New Opportunities
Revenue
Overhead Distribution
Underground Distribution
Transmission
Substation
Truck Fabrication
Storm
T&D Revenue
Engineering and Siting
Klondyke (Union Construction)
Pine Valley (Union Construction)
International
Appendix
Review of Projections - Revenue
New Opportunities
Revenue
2009A
Revenue Growth Breakdown
$265.0
87.5
52.0
18.4
152.8
$575
$613
2009A
Source: Pioneer Forecast and August 2013 Management case. Note: Dollars in millions.
2010A
$248.6
23.7
$451
$53
$504
LOX For more investment banking materials, visit www.10xebitda.com
2010A
2.6%
(3.7%)
5.6%
608.6%
9.3%
10.6%
65.2%
811.2%
15.4%
2011A
$258.0
73.5
29.7
$489
$76
$594
2011A
(3.7%)
608.6%
10.6%
65.2%
811.2%
15.4%
2012A
$300.2
64.5
70.7
31.4
70.5
$540.7
46.3
18.9
10.1
$685.2
2012A
16.4%
2.6%
(3.7%)
608.6%
8.3%
10.6%
65.2%
811.2%
15.4%
11
Fiscal Year Ending June 30,
2013A
2014E
$270.8
10.8
155.0
$632.9
$156
$918.7
10.5%
218.8%
121.0%
17.0%
125.3%
114.7%
28.5%
(37.7%)
$314.1
67.3
34.1%
8.3
48.9
$560.8
Fiscal Year Ending June 30,
2013A
2014E
$155
54.5
41.4
(0.1)
$811.9
18.0%
(2.5%)
(23.0%)
(11.4%)
(0.4%)
(45.2%)
71.1%
(101.5%)
(11.6%)
2015E
$314.1
67.3
101.2
33.7
50.0
$566.3
$171
60.0
48.0
$887.4
2015E
10.0%
5.0%
6.5%
1.0%
10.0%
2.0%
9.3%
2016E
$333.0
74.0
111.3
35.4
1
50.0
$603.7
$187.8
49.8
211.6
$1,119.0
2016E
10.0%
5.0%
6.6%
10.0%
17.8%
340.5%
26.1%
2017E
$349.6
79.9
37.2
50.0
$637.0
71.2
55.8
227.8
$1,194.7
2017E
5.0%
8.0%
8.0%
5.0%
5.5%
8.0%
8.0%
12.1%
7.6%
6.8%
2018E
$367.1
30.1
50.0
$666.3
$213
74.8
59.7
225.1
$1,238.9
2018E
5.0%
5.0%
5.0%
4.6%
5.0%
3.7%
Bank of America
Merrill LynchView entire presentation