Pathward Financial Results Presentation Deck
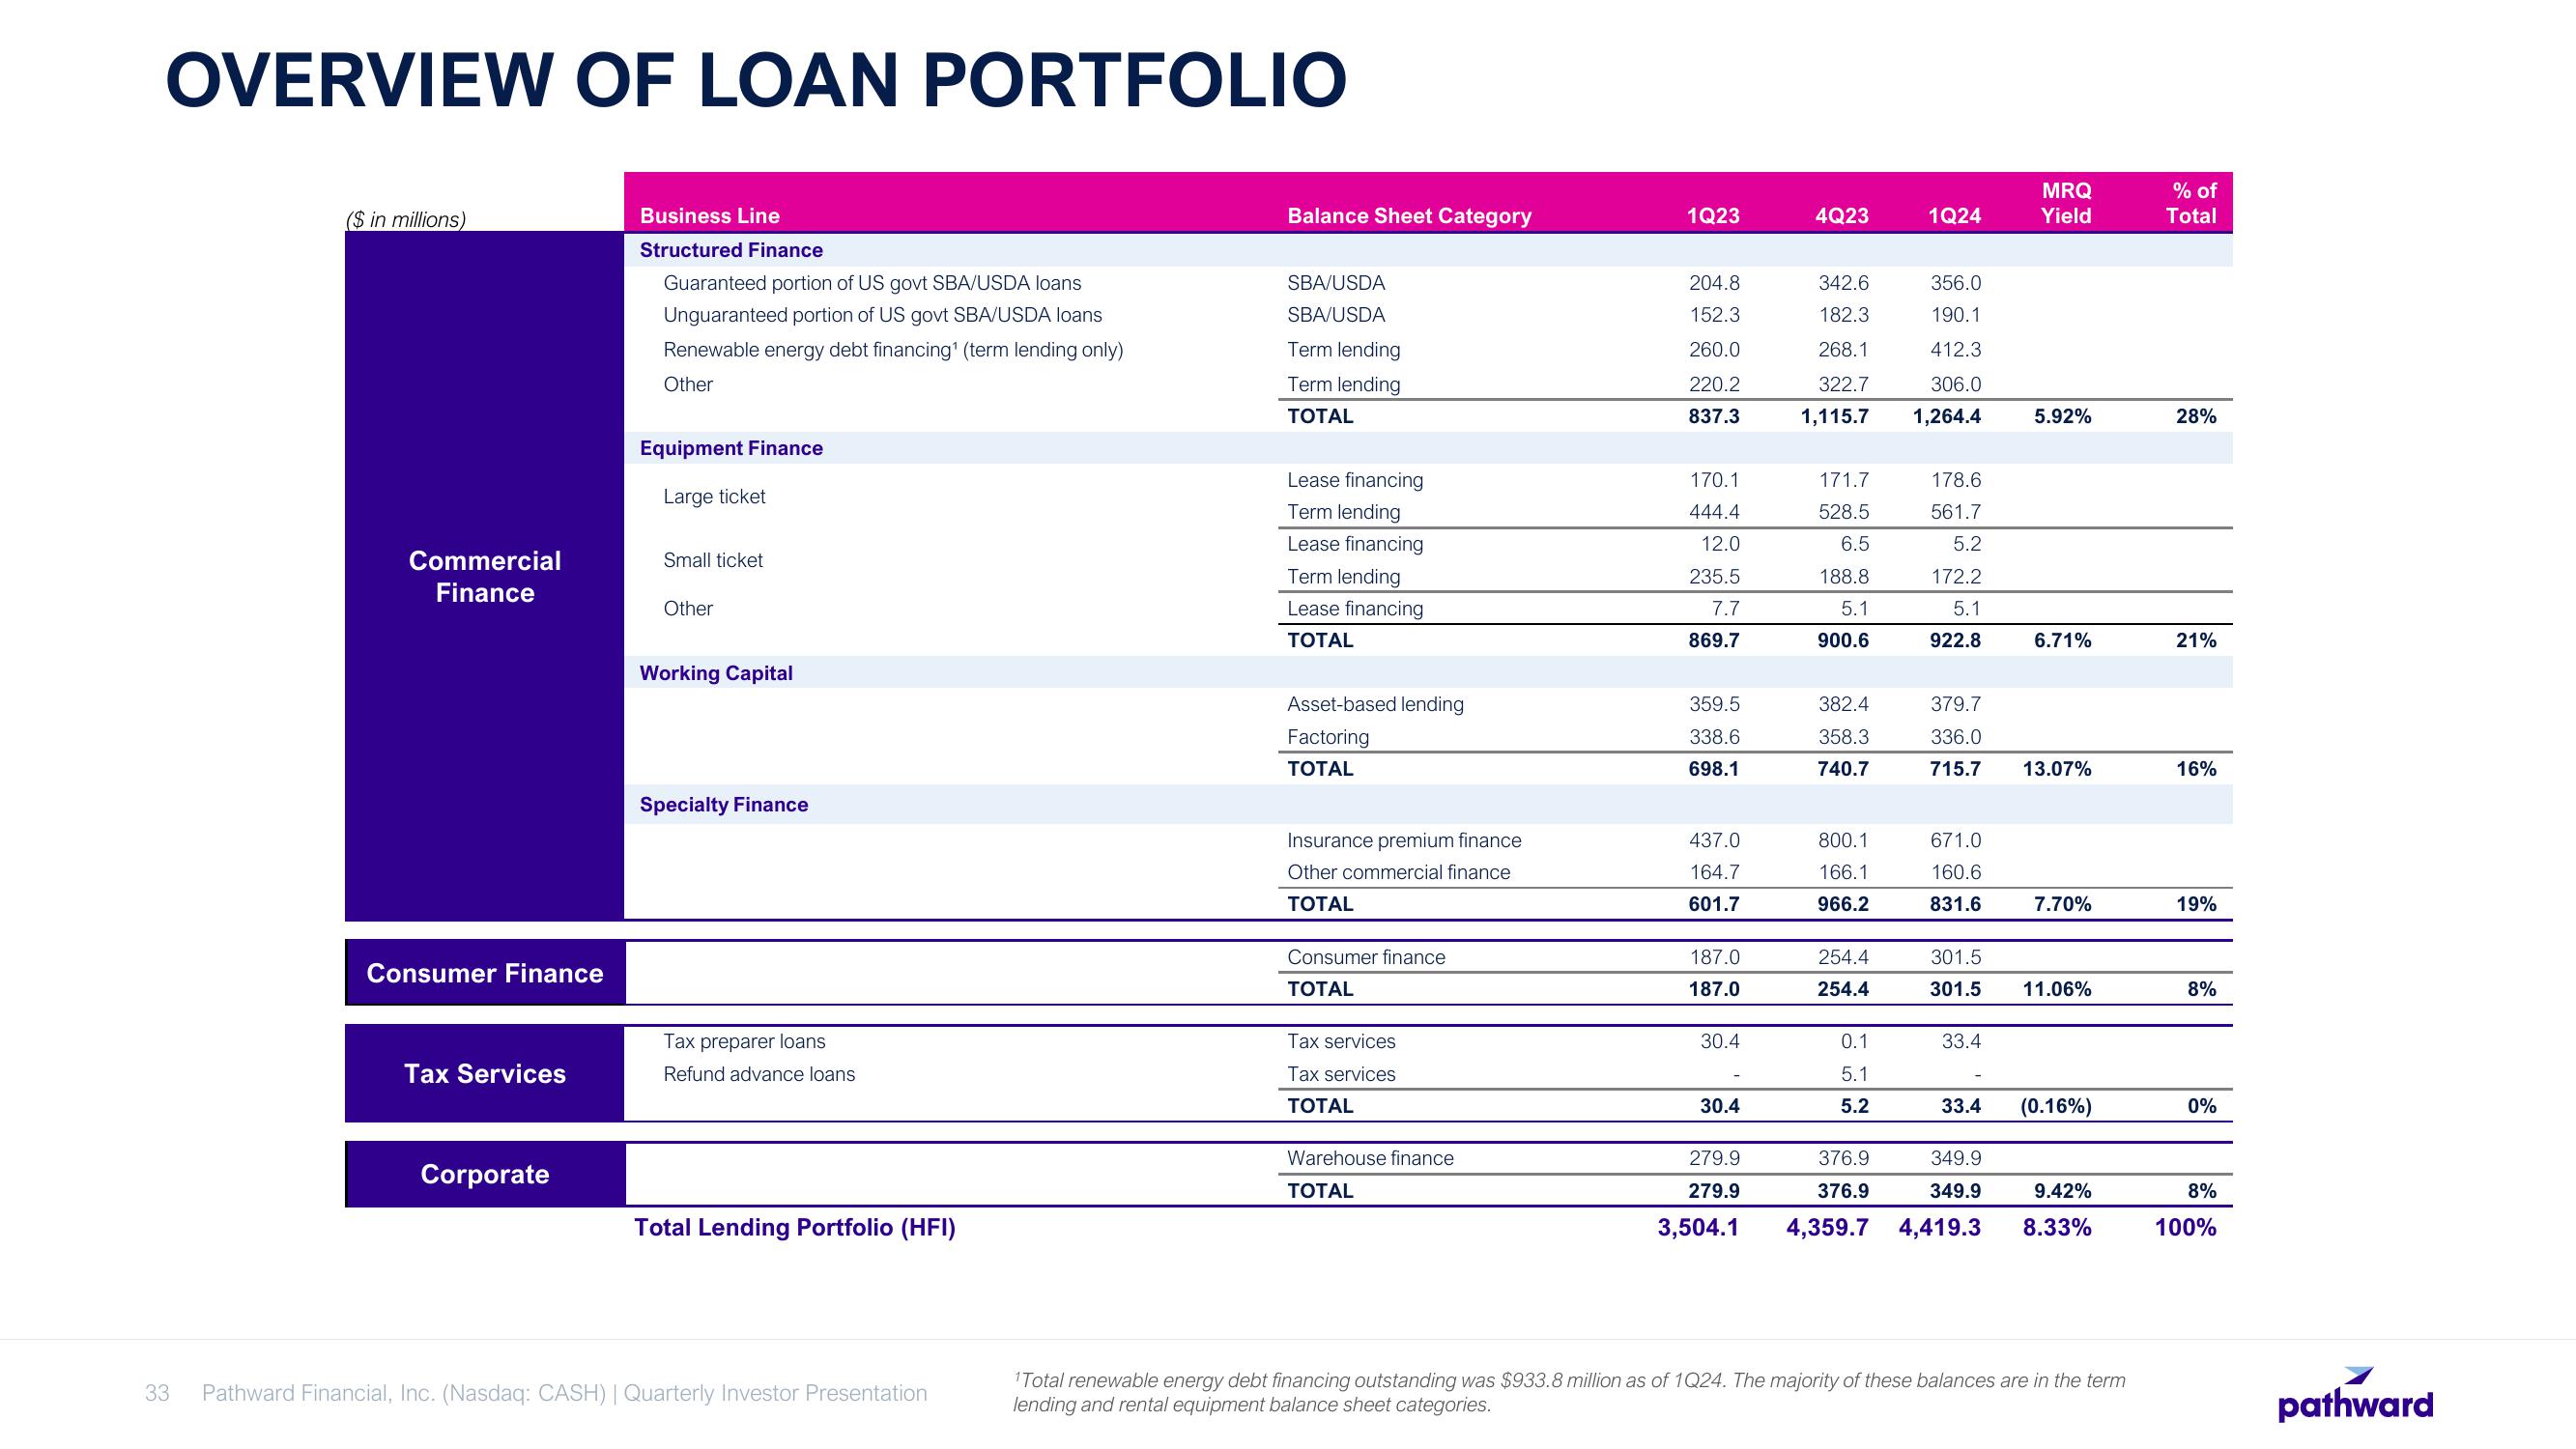
OVERVIEW OF LOAN PORTFOLIO
33
($ in millions)
Commercial
Finance
Consumer Finance
Tax Services
Corporate
Business Line
Structured Finance
Guaranteed portion of US govt SBA/USDA loans
Unguaranteed portion of US govt SBA/USDA loans
Renewable energy debt financing¹ (term lending only)
Other
Equipment Finance
Large ticket
Small ticket
Other
Working Capital
Specialty Finance
Tax preparer loans
Refund advance loans
Total Lending Portfolio (HFI)
Pathward Financial, Inc. (Nasdaq: CASH) | Quarterly Investor Presentation
Balance Sheet Category
SBA/USDA
SBA/USDA
Term lending
Term lending
TOTAL
Lease financing
Term lending
Lease financing
Term lending
Lease financing
TOTAL
Asset-based lending
Factoring
TOTAL
Insurance premium finance
Other commercial finance
TOTAL
Consumer finance
TOTAL
Tax services
Tax services
TOTAL
Warehouse finance
TOTAL
1Q23
204.8
152.3
260.0
220.2
837.3
170.1
444.4
12.0
235.5
7.7
869.7
359.5
338.6
698.1
437.0
164.7
601.7
187.0
187.0
30.4
30.4
279.9
279.9
3,504.1
4Q23
356.0
342.6
182.3
190.1
268.1
322.7
1,115.7 1,264.4
412.3
306.0
171.7
528.5
6.5
188.8
5.1
900.6
382.4
358.3
740.7
800.1
166.1
966.2
254.4
254.4
1Q24
0.1
5.1
5.2
178.6
561.7
5.2
172.2
5.1
922.8
379.7
336.0
715.7
671.0
160.6
831.6
33.4
MRQ
Yield
33.4
5.92%
6.71%
13.07%
301.5
301.5 11.06%
7.70%
(0.16%)
349.9
349.9
4,359.7 4,419.3 8.33%
376.9
376.9
9.42%
¹Total renewable energy debt financing outstanding was $933.8 million as of 1Q24. The majority of these balances are in the term
lending and rental equipment balance sheet categories.
% of
Total
28%
21%
16%
19%
8%
0%
8%
100%
pathwardView entire presentation