Stem SPAC Presentation Deck
stem Operational Benchmarking
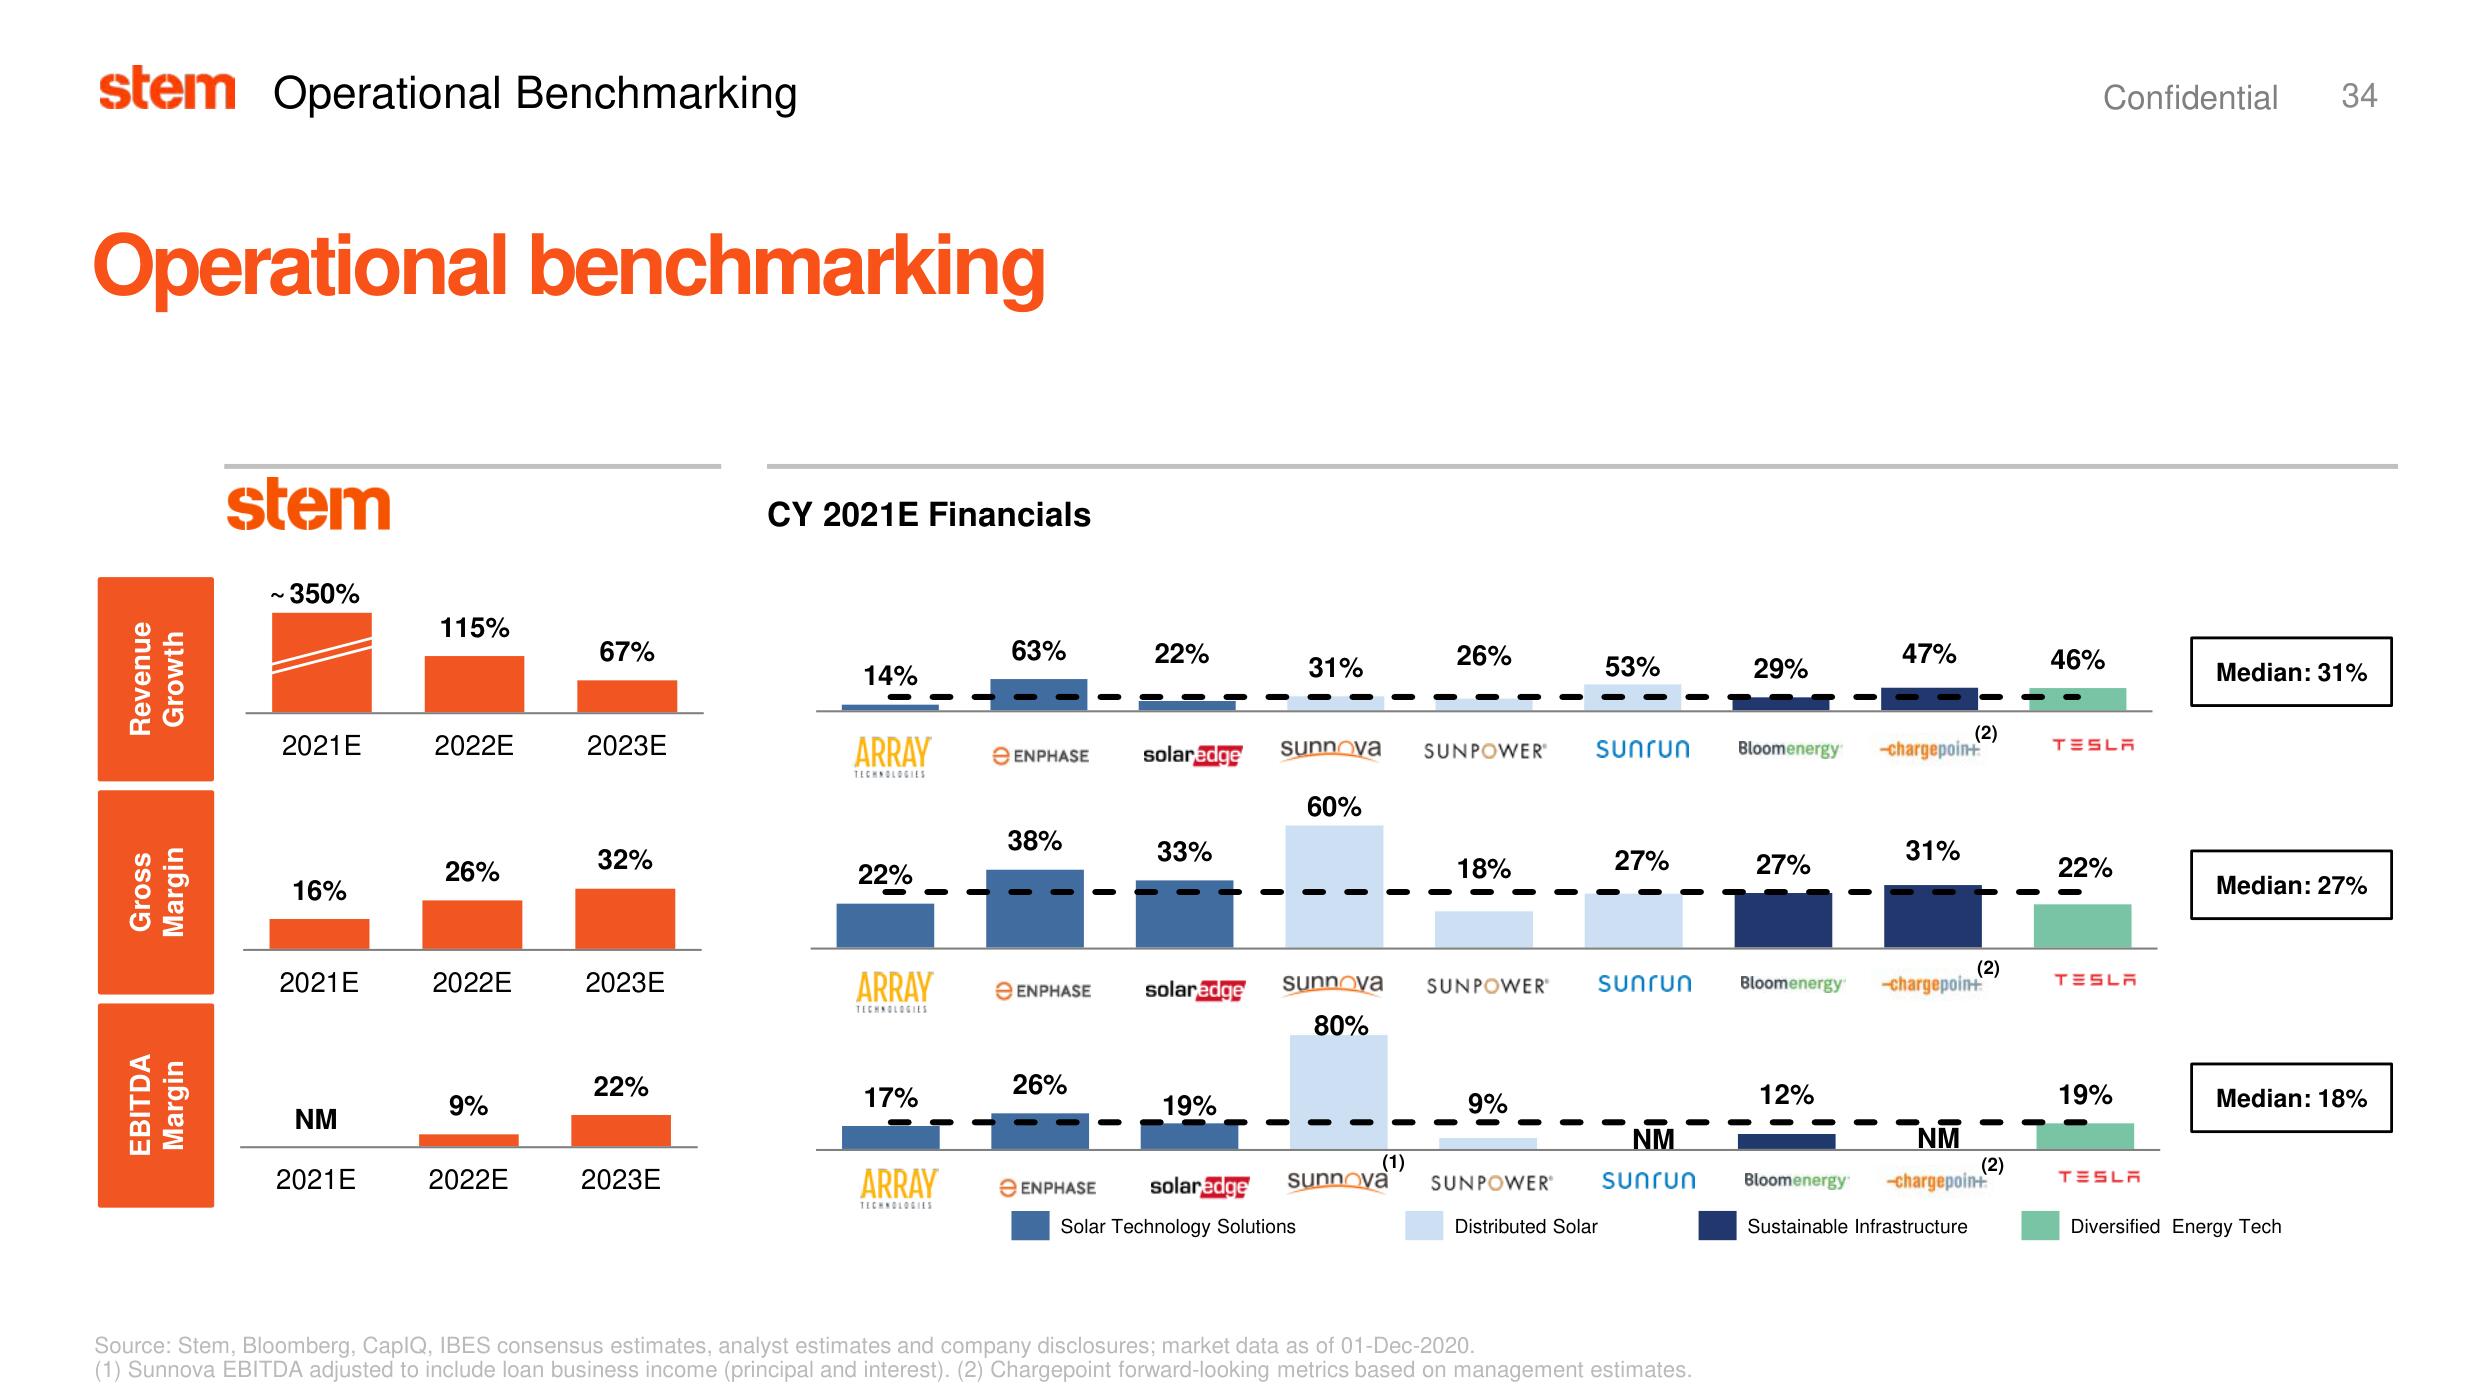
Operational benchmarking
Revenue
Growth
Gross
Margin
EBITDA
Margin
stem
~ 350%
2021E
16%
2021 E
NM
2021E
115%
2022E
26%
2022E
9%
2022E
67%
2023E
32%
2023E
22%
2023E
CY 2021E Financials
14%
ARRAY
TECHNOLOGIES
22%
ARRAY
TECHNOLOGIES
17%
ARRAY
TECHNOLOGIES
63%
e ENPHASE
38%
22%
26%
solaredge
33%
e ENPHASE solaredge
19%
31%
sunnova
solaredge
e ENPHASE
Solar Technology Solutions
60%
sunnova
80%
(1)
sunnova
26%
SUNPOWER®
18%
SUNPOWER
9%
53%
SUNPOWER®
Distributed Solar
27%
sunrun
sunrun Bloomenergy -chargepoin+
NM
sunrun
29%
Source: Stem, Bloomberg, CapIQ, IBES consensus estimates, analyst estimates and company disclosures; market data as of 01-Dec-2020.
(1) Sunnova EBITDA adjusted to include loan business income (principal and interest). (2) Chargepoint forward-looking metrics based on management estimates.
27%
47%
12%
(2)
31%
(2)
Bloomenergy -chargepoint
NM
Bloomenergy -chargepoin+
Sustainable Infrastructure
(2)
46%
Confidential 34
TESLA
22%
TESLA
19%
TESLA
Median: 31%
Median: 27%
Median: 18%
Diversified Energy TechView entire presentation